
 Biodiversity
Key points
- Australia’s threatened species list grew again in 2025, with climate change affecting nine in ten newly listed species. The 2025 Threatened Species Index shows substantial long‑term declines across most species groups, with frogs and reptiles experiencing the steepest declines.
Threatened species listings
The number of threatened species on the Environment Protection and Biodiversity Conservation Act 1999 (EPBC Act) list increased to 2,175. This represents a 54% increase (763 additions) since 2000.
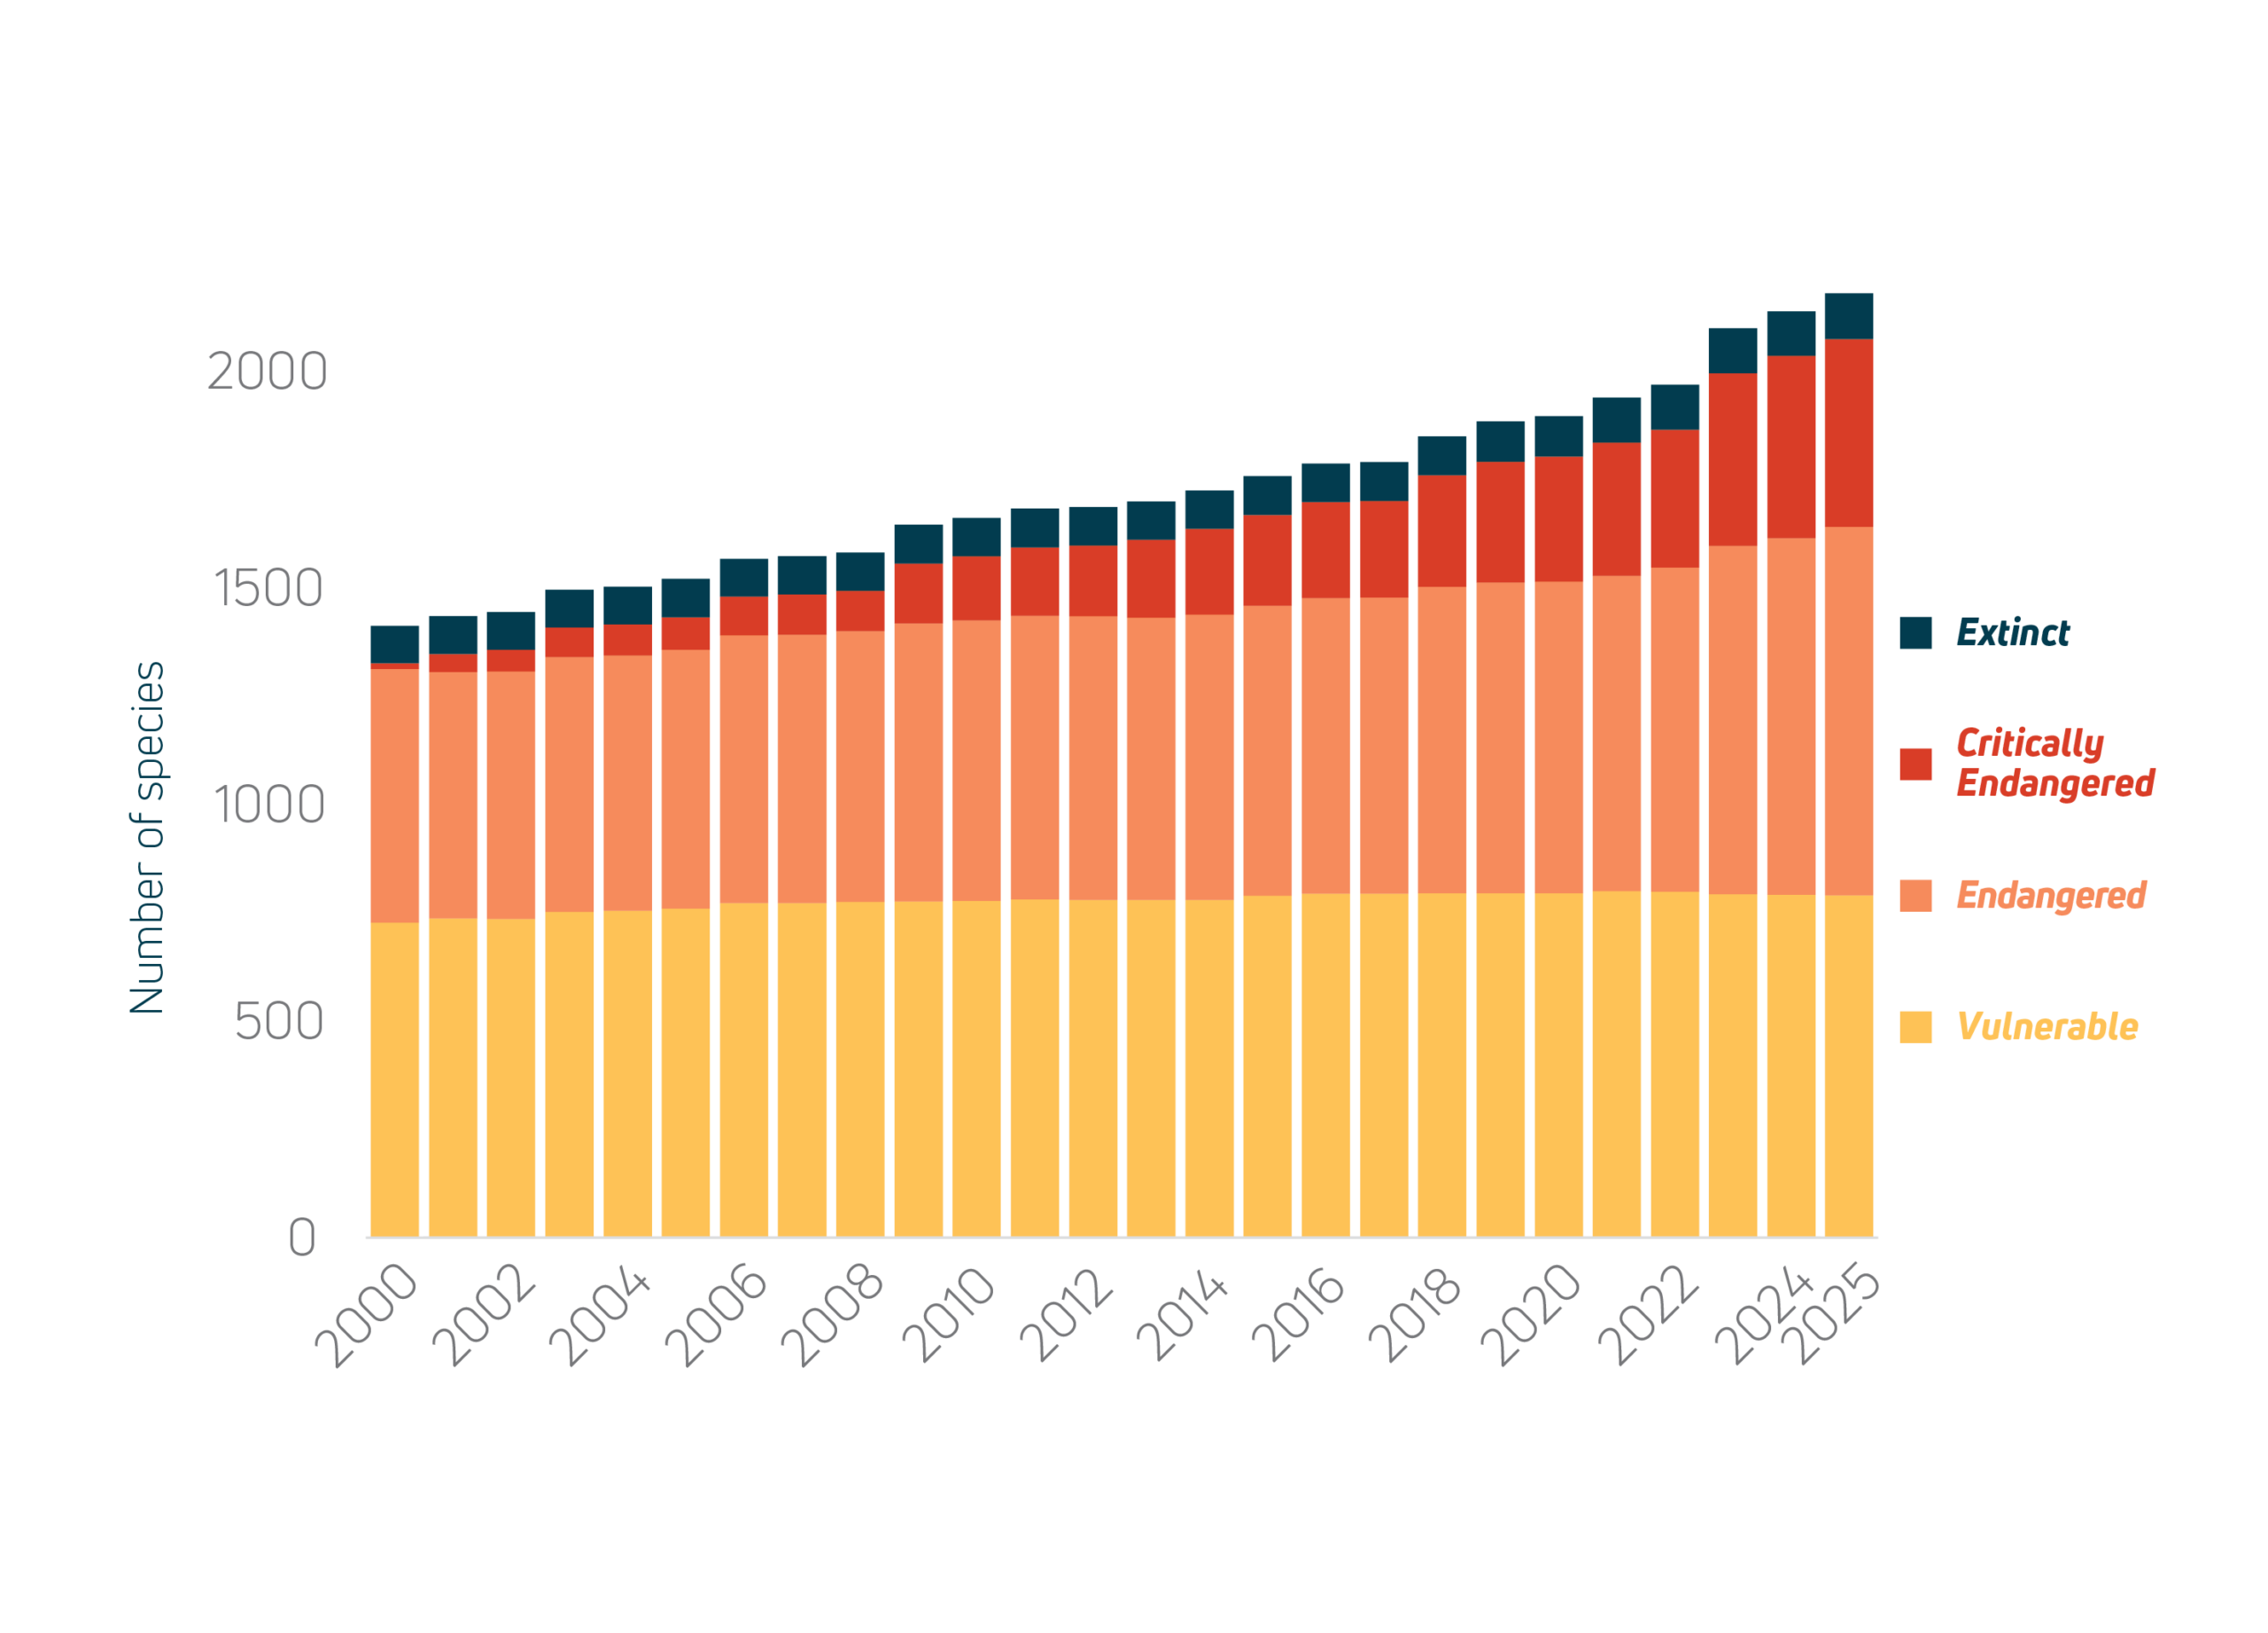
Thirty-nine species were added to the list in 2025, down from the record 130 added in 2023, but still above the average rate of 31 additions per year. Additionally, eight species were uplisted to a higher category of extinction risk. The proportion of species listed as Critically Endangered (the highest category of threat) has increased from 1% (n = 13) in 2000 to 20% (n = 434) in 2025. No species were downlisted to a lower category of extinction risk.
More non-vertebrate taxa were listed in 2025, a group typically underrepresented on the EPBC Act List. Five Endangered and three Critically Endangered freshwater crayfish in the genus Euastacus were listed. They are threatened by degradation of freshwater habitats due to climate change, and several species face additional pressure from illegal collection for the aquarium trade. Beyond listing changes, over 100 species were newly described in 2025, many of them invertebrates, highlighting the extent of undocumented diversity among these groups.
Marine species, also typically underrepresented on the EPBC Act List, saw two additions in 2025: the Australian humpback dolphin Sousa sahulensis and the Australian snubfin dolphin Orcaella heinsohni, both listed as Vulnerable. They are threatened by entanglement with fishing gear, marine pollution, coastal development, and increasing marine heatwave frequency due to climate change.
Impacts of the 2019–20 Black Summer bushfires continue to emerge, owing to time lags between disturbance and observable population-level effects, such as reduced recruitment. Further delays arise from the time needed for data collection, analysis, and updating conservation listing advice. The fire extent overlapped the range of 44% of newly listed species (14 plants and 3 frogs) and 63% of uplisted species (8 plants). Looking at the broader period since the fires, 52% of the 289 species added to the list since 2019 were impacted by the fires. Likewise, of the 77 species uplisted to a higher category of threat, 57% were impacted. The degree of overlap with the fire area, burn severity, and population-level impacts varied widely.
The Critically Endangered ‘Dry rainforests of south-east New South Wales and eastern Victoria’ was added to the List of Threatened Ecological Communities, bringing the total number of listed communities to 106. This community represents some of the southernmost rainforest globally. Its distribution is severely restricted, confined to naturally patchy microclimates such as moist rocky gullies and outcrops. Increased fire frequency is a key threat, compounded by interactions with other threatening processes including climate change.
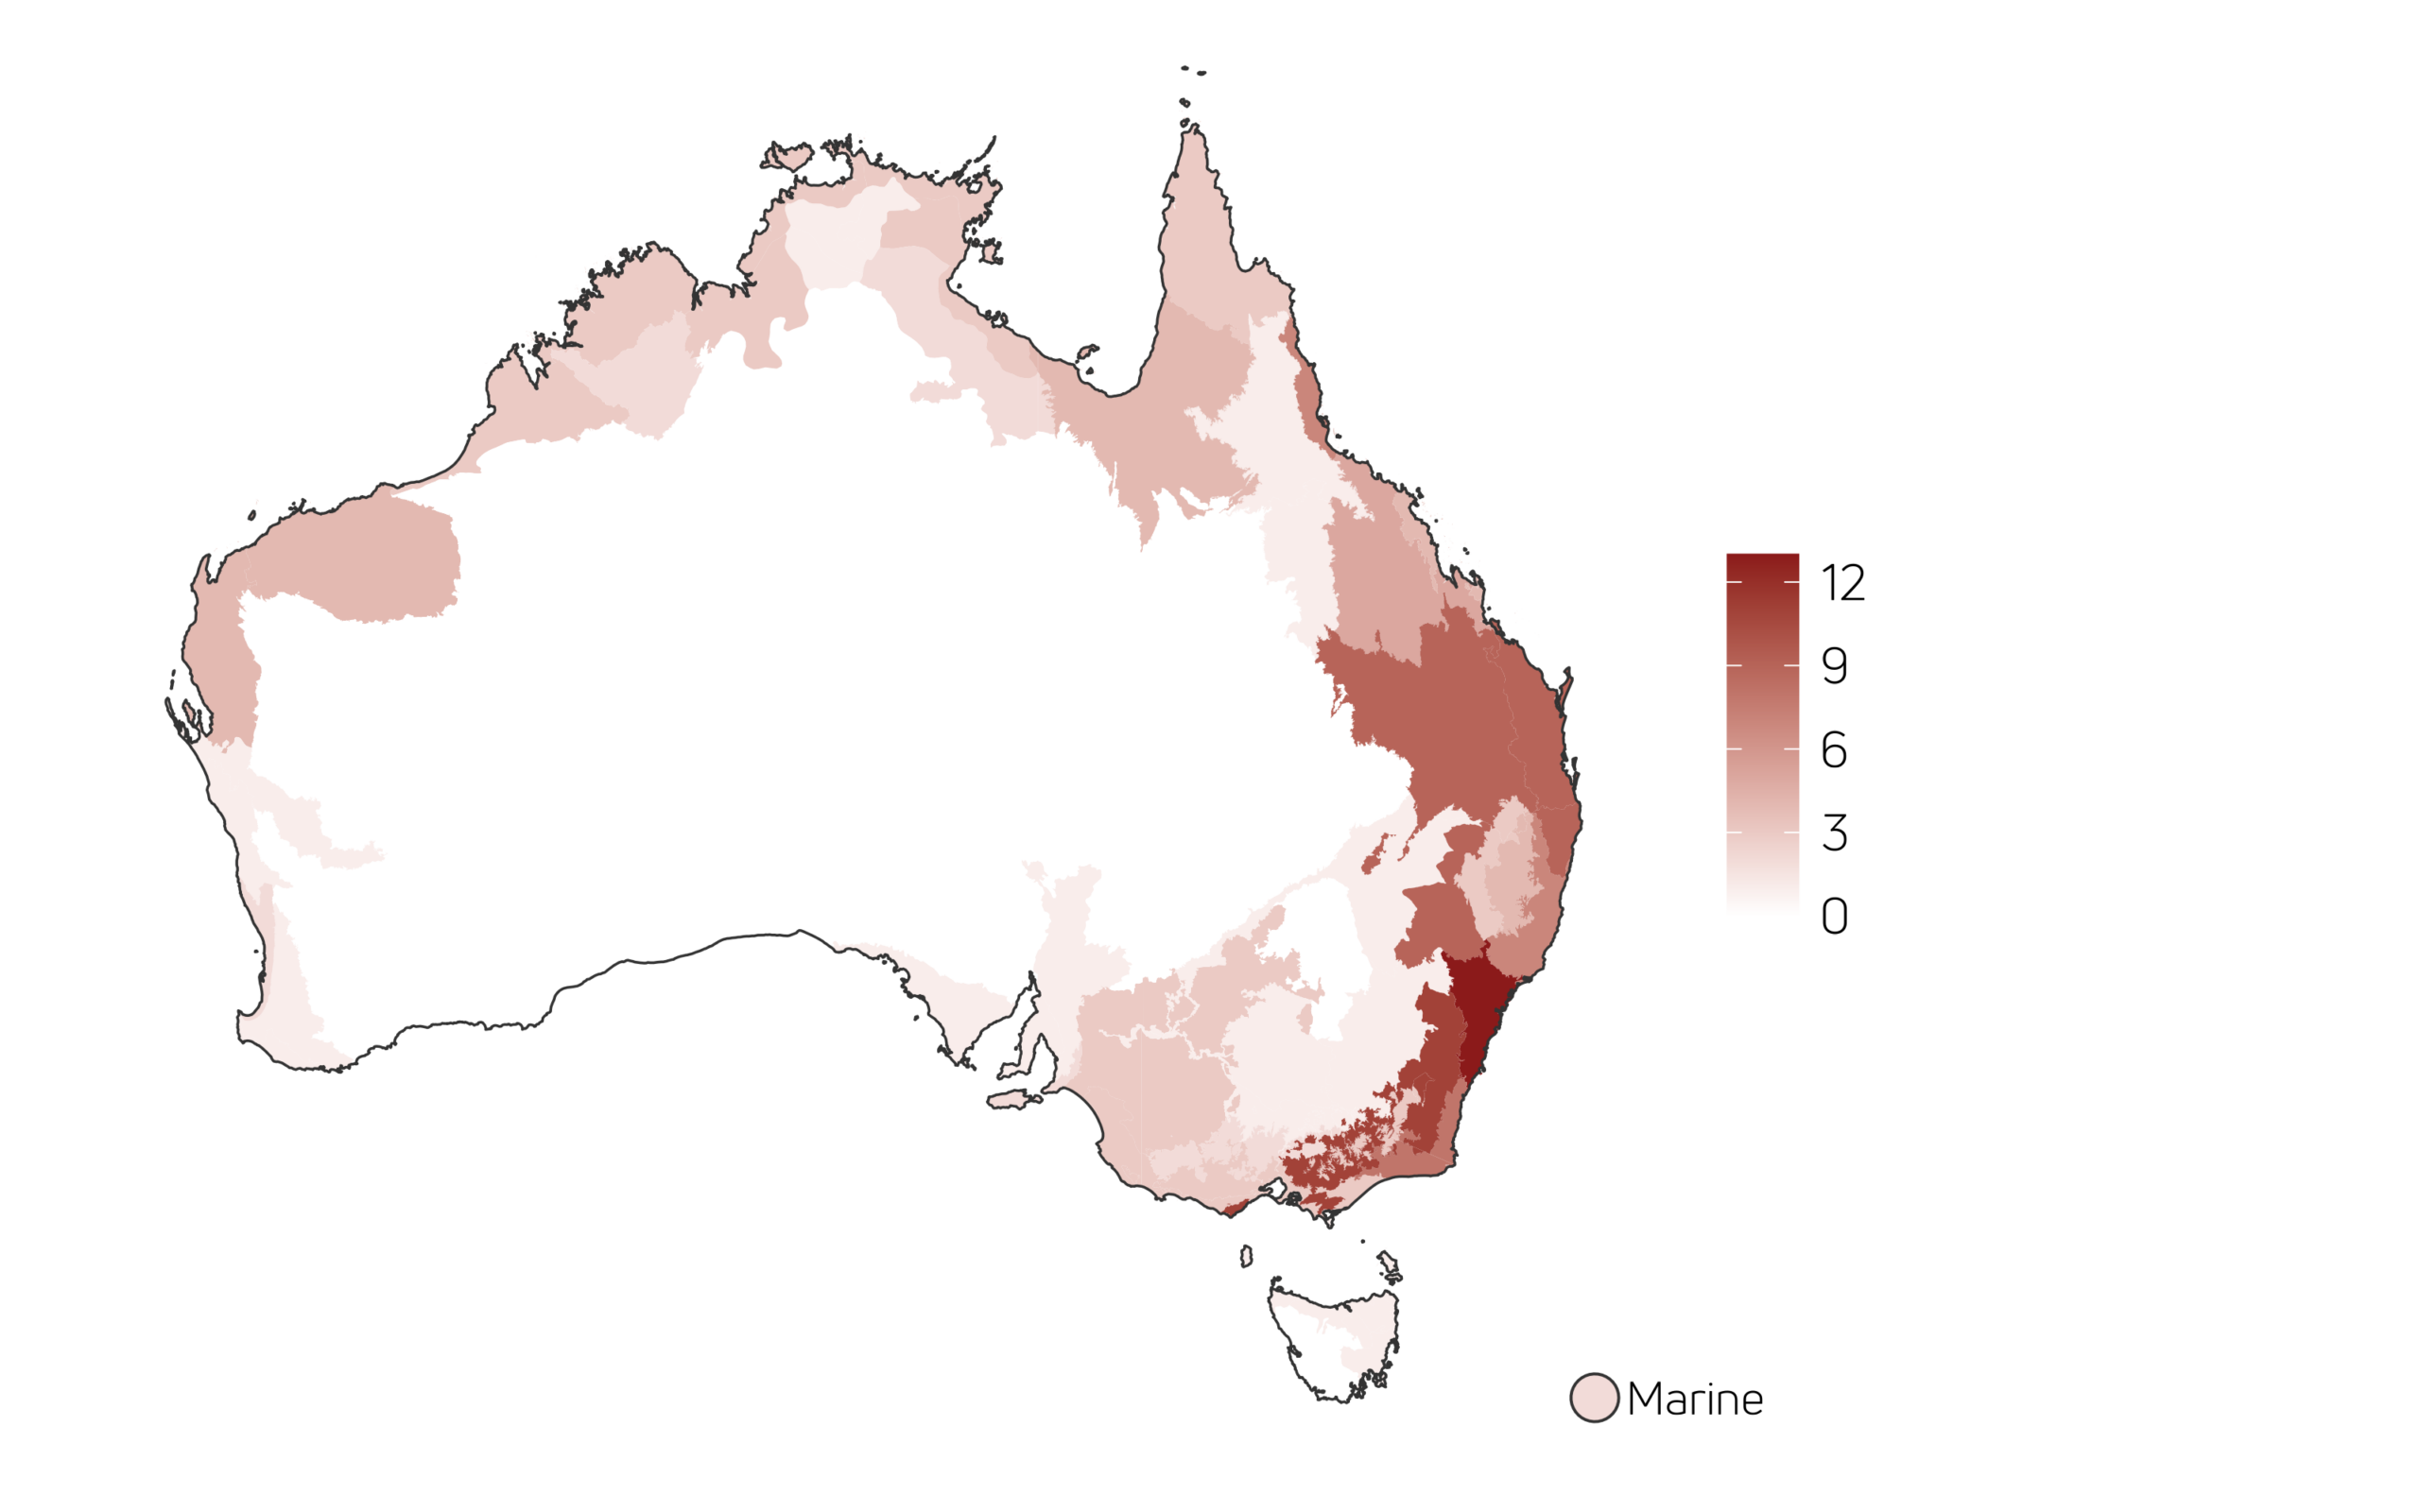
At the bioregional level, the Sydney Basin had the highest number of additions to the threatened species list (13 additions) for the second year in a row, followed by the South Eastern Highlands (11), the Brigalow Belt South (9), and South Eastern Queensland (9).
No species were removed from the list. Two species were replaced on the list by their constituent subspecies. Although the higher- order taxa were formally removed, this did not represent a change in conservation status.
Kati Thanda–Lake Eyre filled in 2025, triggering a significant breeding and growth event. Mass emergence of brine shrimp and subsequent fish spawning attracted millions of breeding birds. Endangered species such as the dusky hopping-mouse Notomys fuscus and Bulloo grey grasswren Amytornis barbatus barbatus stand to benefit from vegetation growth in the broader basin.
Threatened Species Index
The Threatened Species Index (TSX) tracks changes in the abundance of threatened and near-threatened species in Australia. In 2025, alongside updates to the bird, mammal, plant and amphibian indices, Australia’s first Threatened Reptile Index was introduced.
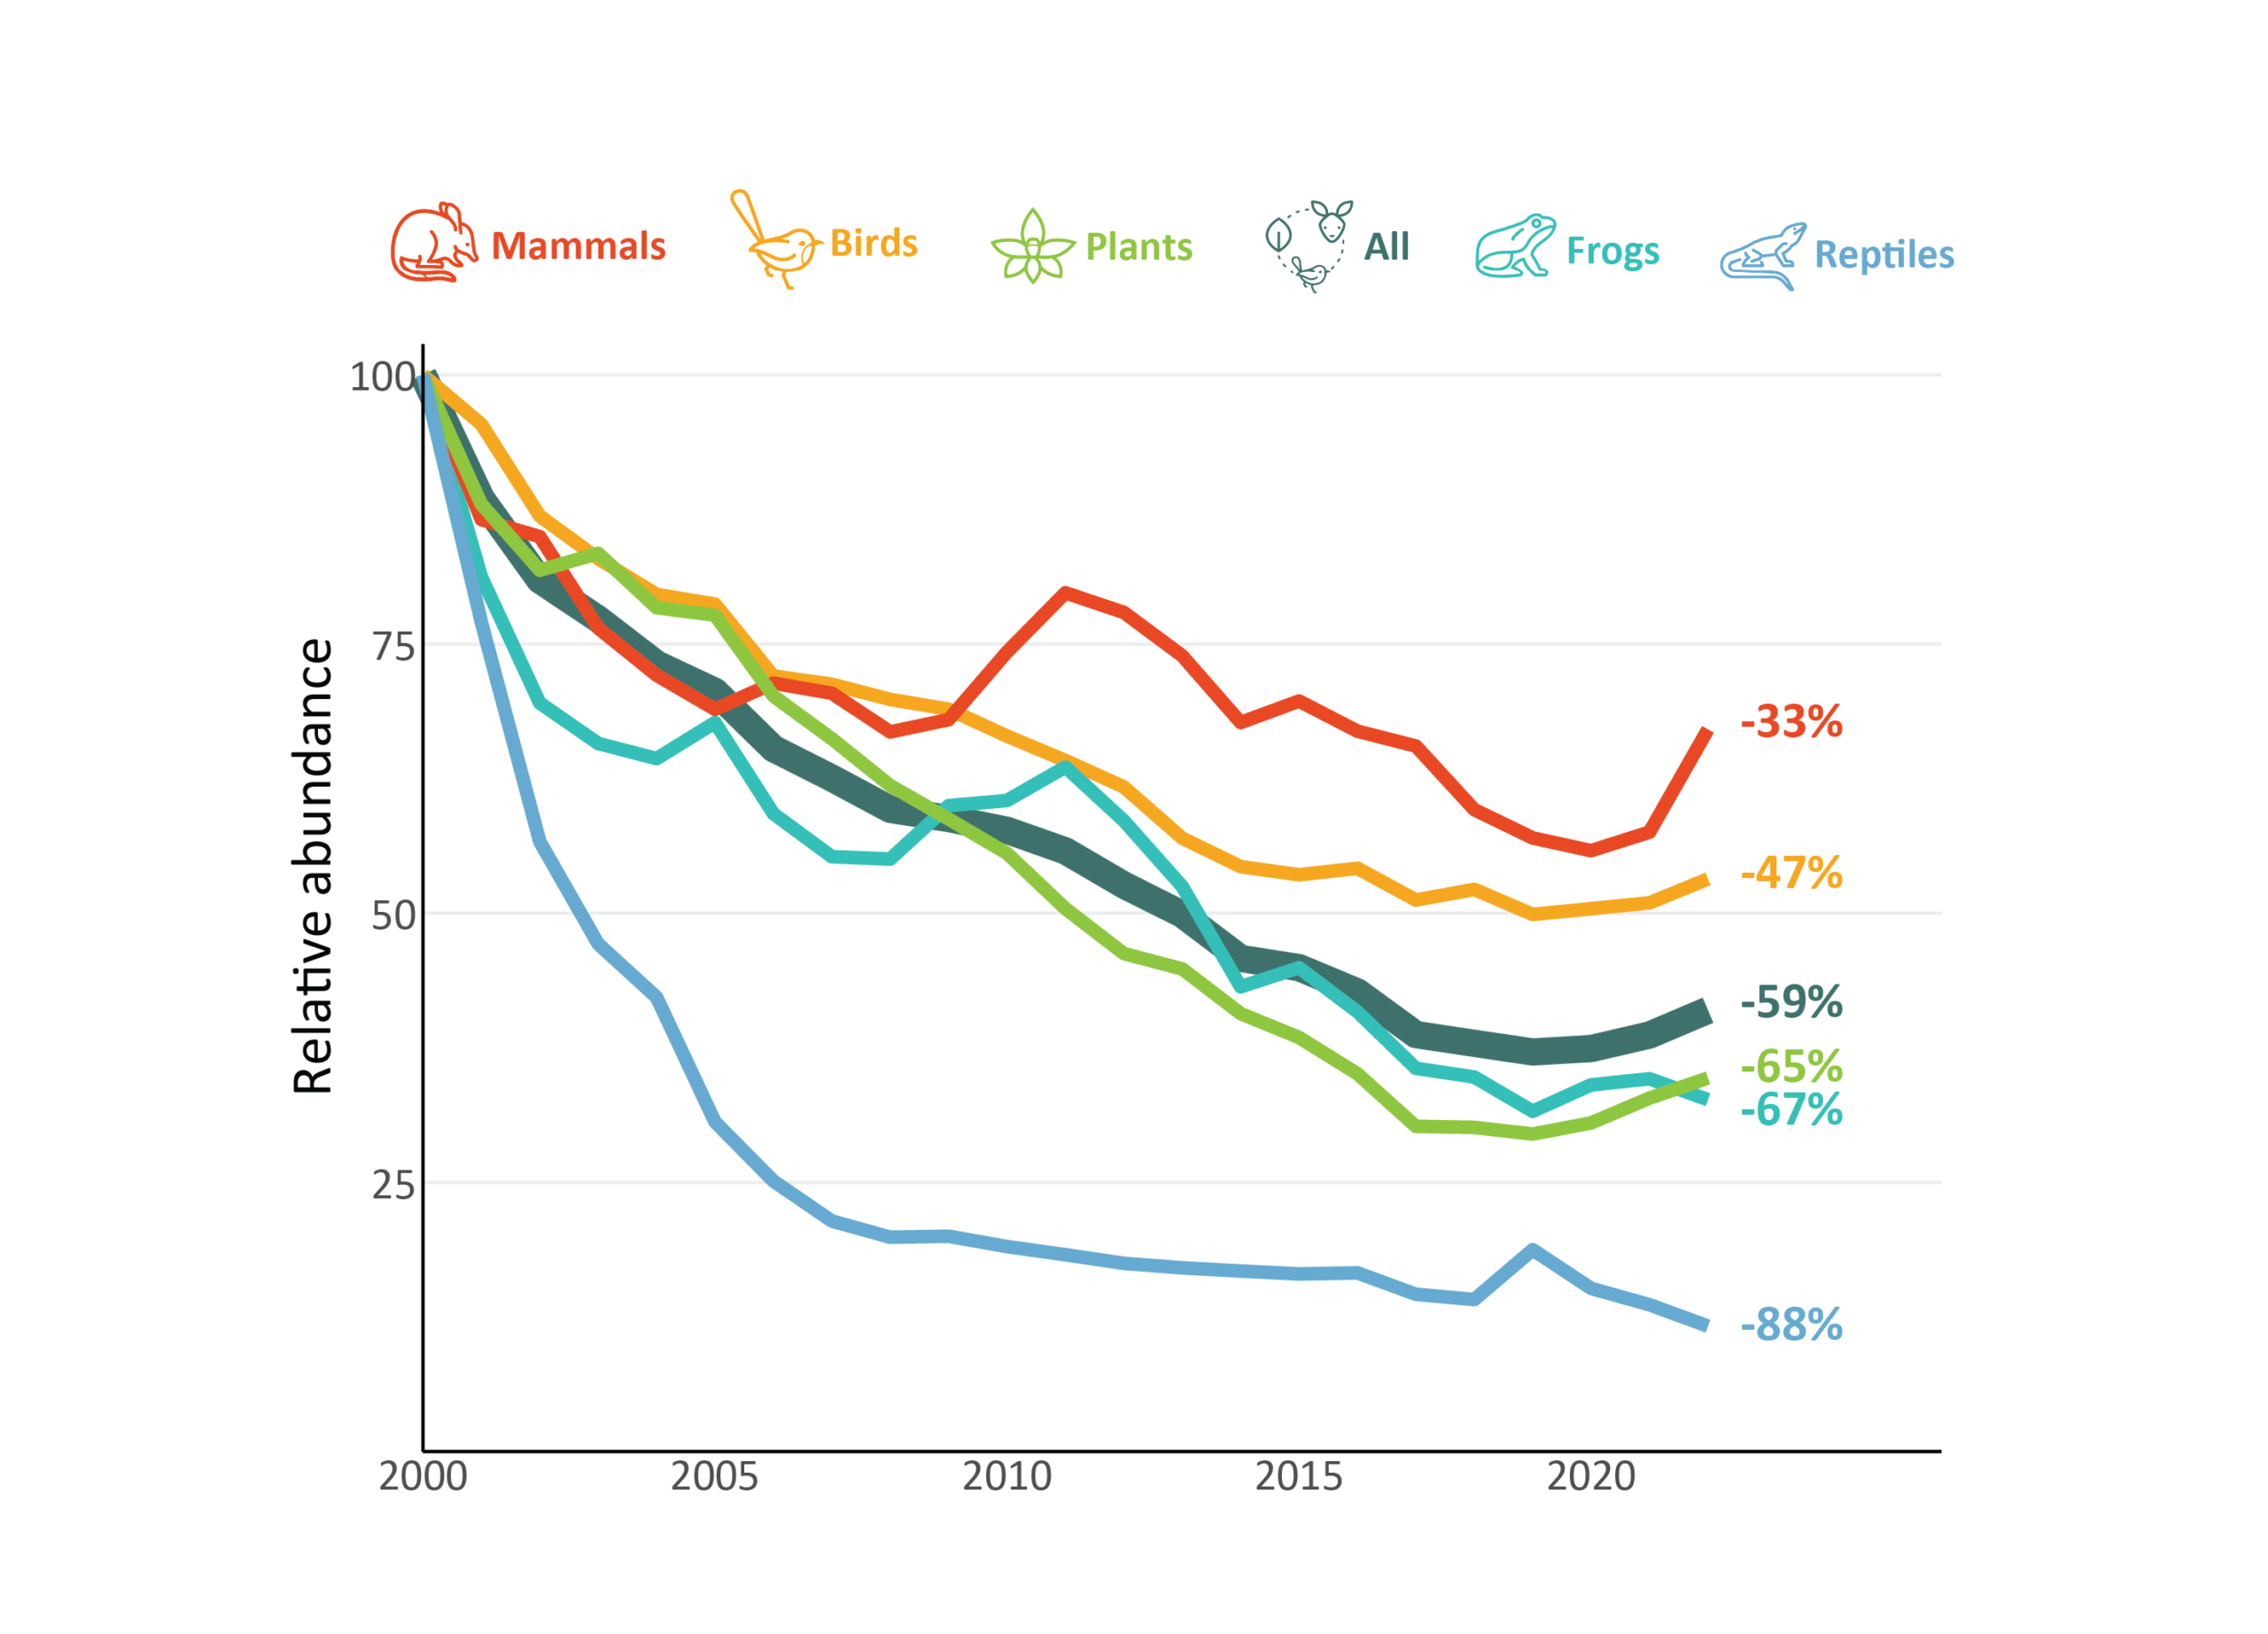
Overall, the species listed as threatened under the EPBC Act and included in the TSX have experienced pronounced long-term declines, averaging 59% since 2000. The 2025 TSX update indicates that overall trends across all groups increased by 2% between 2021 and 2022, building on the 1% increase observed from 2020 to 2021. This upward shift reflects a slowing of earlier declines, with some species groups showing signs of stabilisation. However, additional years of consistent and standardised monitoring are required to more confidently determine whether the observed increase represents a meaningful directional change.
The 2025 TSX update reports on the collation of the first national monitoring dataset for Australia’s threatened herpetofauna. Among the reptile and frog species listed as threatened under the EPBC Act and included in the TSX, preliminary data indicate severe long‑term declines. In 2022, abundance was, on average, 88% lower for reptiles and 67% lower for frogs than in 2000. These values correspond to average annual declines of around 4% and 3%, respectively. Long‑term declines of this magnitude, which are among the steepest recorded for any species group in the TSX, likely reflect the cumulative impacts of habitat loss, invasive species, and disease pressures.
The trend for threatened plants was slightly less severe than that of frogs, averaging 65% since 2000. Declines in herbaceous plants were the most pronounced within the group (-88% on average). Bird abundance in 2022 was 47% lower on average than in 2000, with migratory shorebirds experiencing the largest declines of 56% on average. The trend for threatened mammals showed an average decline of 33% since 2000, representing the least severe decline among the species groups included in the TSX.
The latest TSX data demonstrate that species protection and management can be effective measures for slowing declines. For mammals, for example, conservation actions such as feral predator control and habitat restoration have contributed to a relatively stable overall trend, with populations declining by only 16% on average since 2000. In contrast, mammals without direct conservation management have declined by an average of 37% since 2000.
Threatening processes
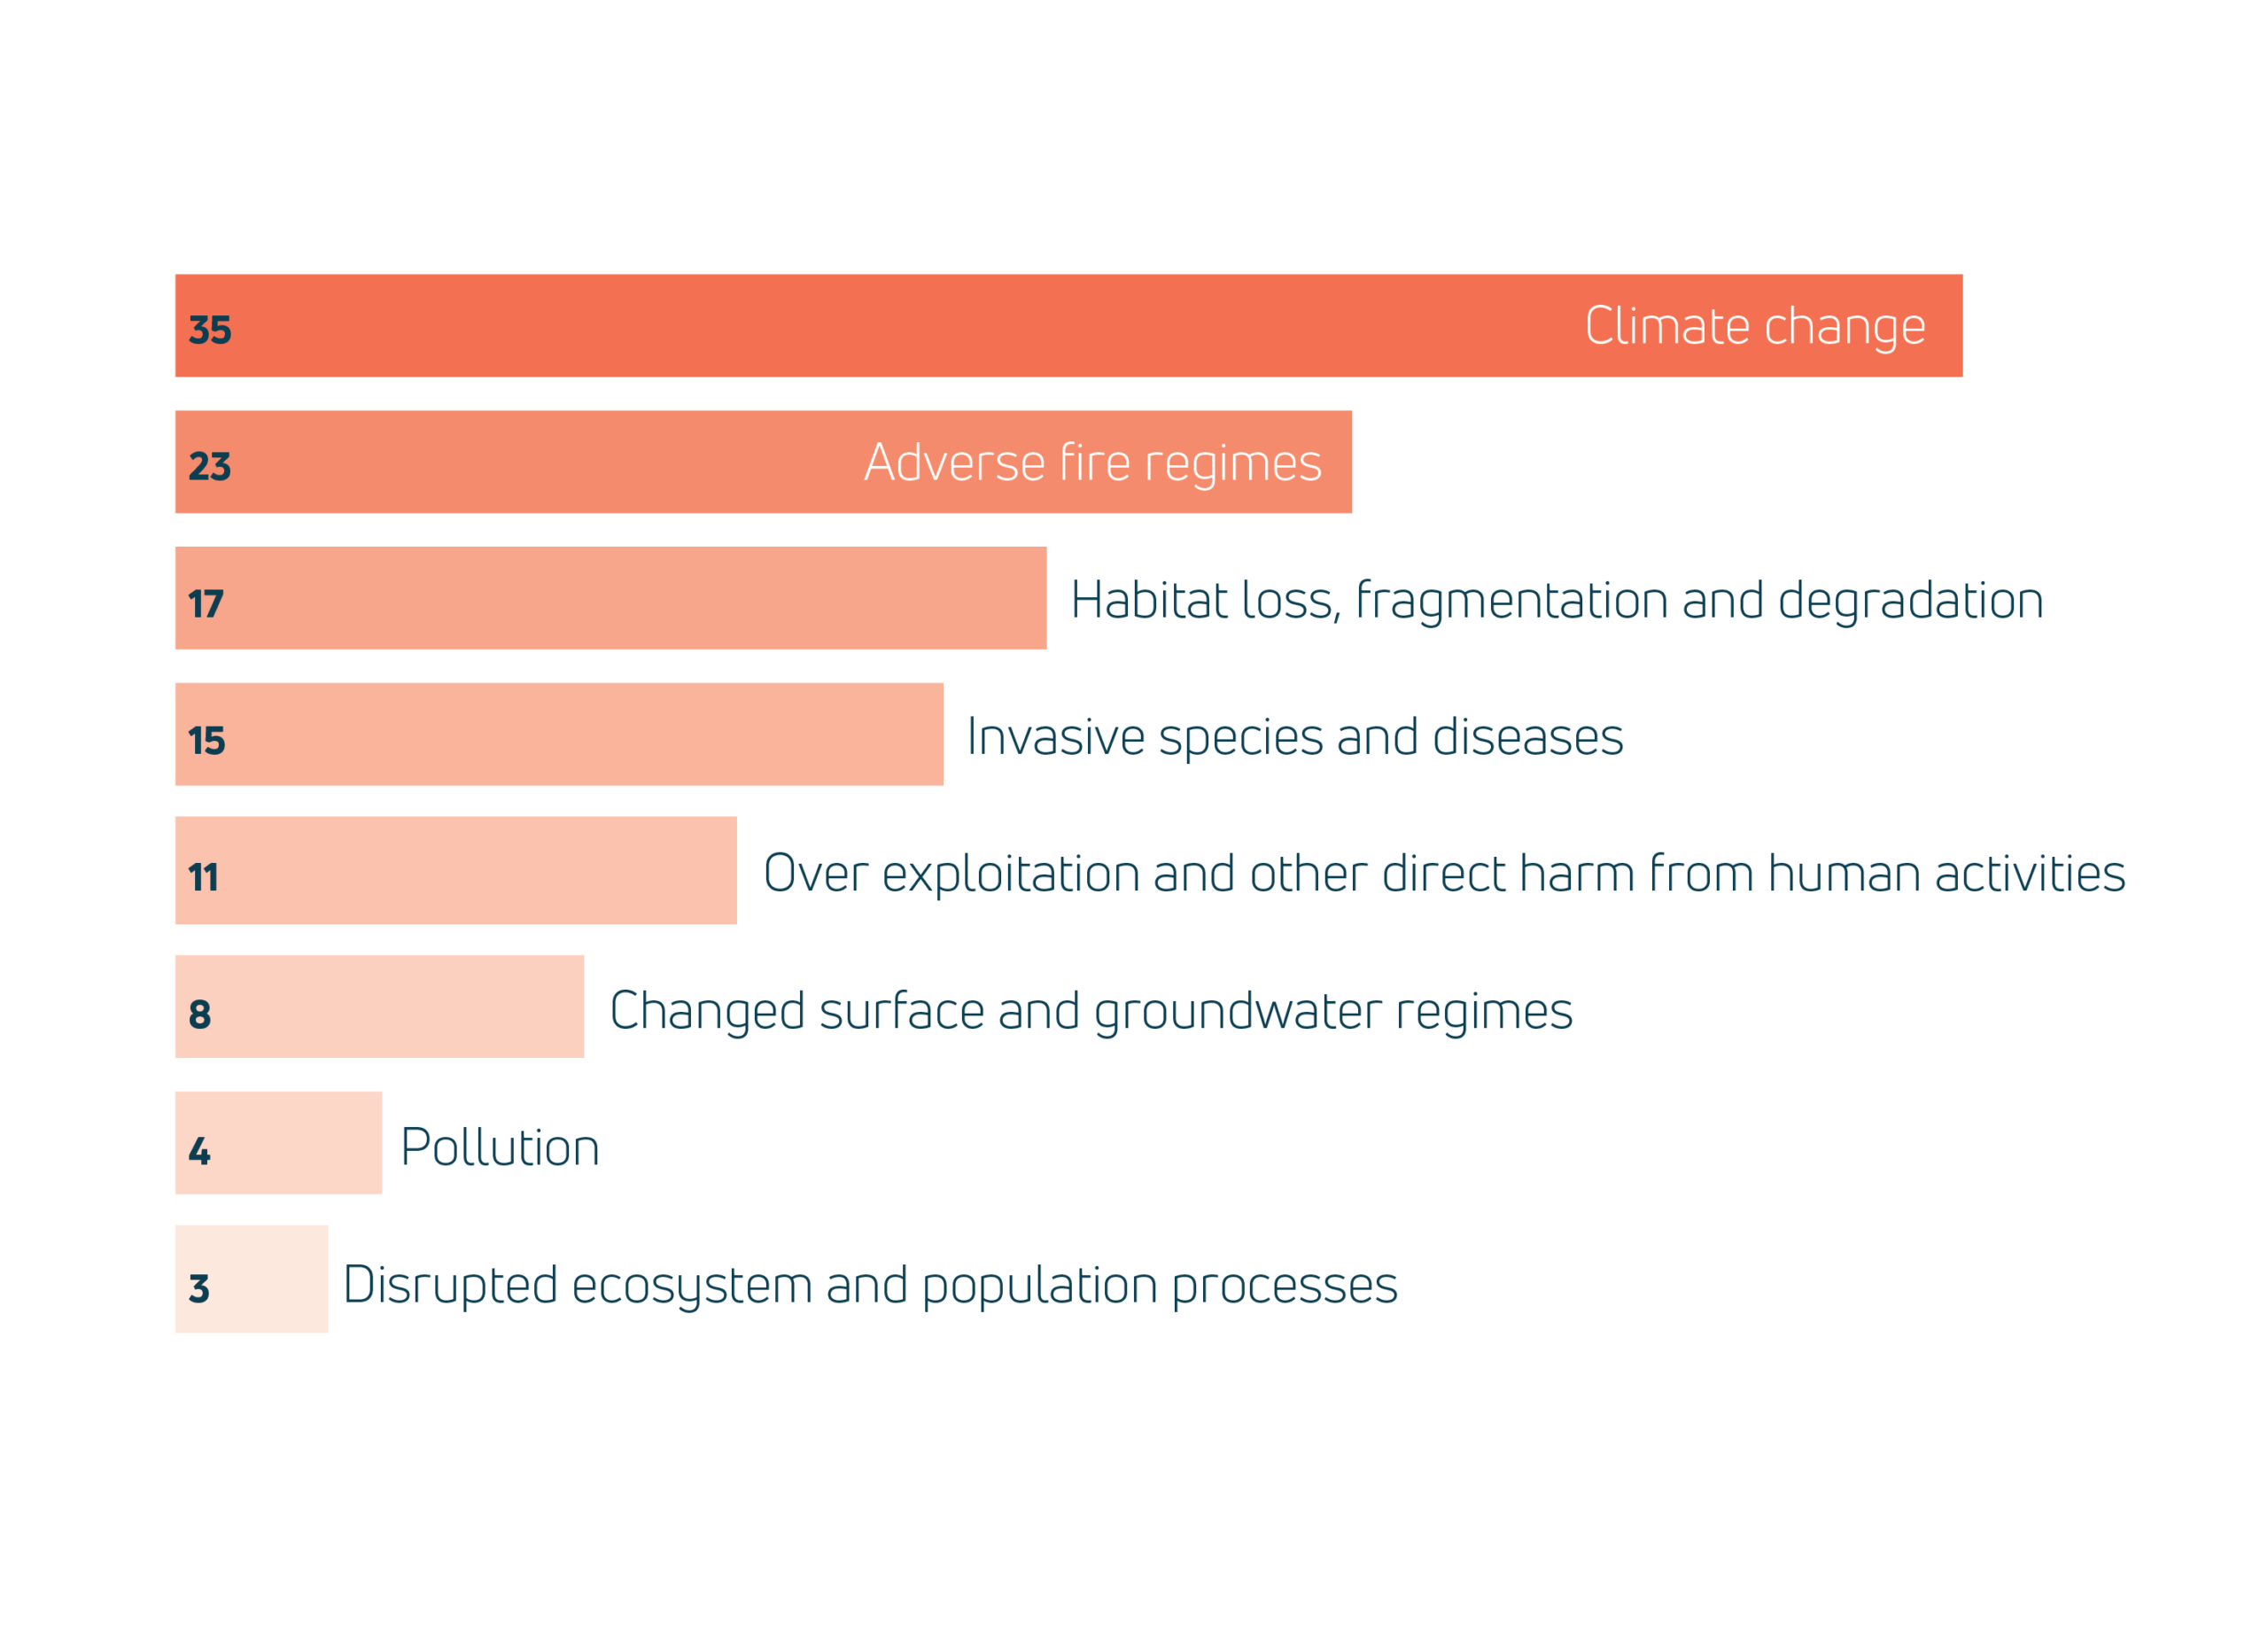
The three most prevalent threats to species listed in 2025 were climate change, adverse fire regimes, and habitat loss, fragmentation, and degradation.
Climate change threatens 90% of newly listed species (35 of 39 species). Some species face multiple climate-related pressures; the eight newly listed crayfish are threatened by storms and flooding, temperature extremes, and drought. Adverse fire regimes threaten 59% of newly listed species (23 of 39). Climate change compounds this threat by increasing fire frequency and severity. Habitat loss threatens 44% (17 of 39) of newly listed species.
Most species listed in 2025 were affected by four or more distinct threatening processes. Many of these threats interact. For example, incursion by invasive predators increases with fire and vehicle tracks, all of which independently threaten the night parrot Pezoporus occidentalis, uplisted to Critically Endangered. Considered potentially extinct for most of the 20th century, the night parrot was rediscovered in 2013 and has since been confirmed at several other localities. It occurs in long unburnt spinifex grasslands. The known subpopulations are extremely small, with fewer than 50 individuals in each.
Endemic species with restricted ranges are particularly sensitive to habitat loss and degradation. The Barrow cave gudgeon Milyeringa justitia was listed as Endangered in 2025. It is endemic to a system of caves and underground streams beneath Barrow Island, where a freshwater aquifer sits above underlying seawater. The island, located 60km off the Pilbara coast of Western Australia, is the site of major oil and gas extraction. The Barrow cave gudgeon and the broader subterranean ecosystem are threatened by effluent, oil spills, and industrial seismic disturbance.
Where does this data come from?
Measures of the condition of natural resources and ecosystems were derived from several spatial data sources.
Weather data was derived by combining station satellite and weather forecast model data.
Data on land cover, inundation, fire, soil condition and vegetation leaf area were derived by automated interpretation of satellite imagery. Biodiversity analysis was based on the DCCEEW SPRAT database and Threatened Species Index (TSX), providing measures of change in the relative abundance of Australia's threatened and near-threatened species at national and regional levels.
The other indicators were estimated by combining the weather and satellite data in ANU's environmental data assimilation system, OzWALD.
For further details on data and methods or to download the data, read more.