
 Global Change
Key points
- In 2025, the rate of CO₂ growth slowed and temperatures eased slightly from their record highs the year before due to a natural cooling pattern in the Pacific. However, greenhouse gas concentrations and temperatures remain at historically extreme levels, while sea ice continues its long-term decline.
Atmospheric CO₂ concentration increased by 2.23 ppm (parts per million) in 2025, the slowest increase in three years. The slower growth — 33% less than the record year before — is largely attributed to La Niña conditions, a natural cooling pattern in the tropical Pacific that strengthens the uptake of carbon by land vegetation in Australia and elsewhere. Concentrations remained within 2% of the average 2000–2024 growth rate. While the rate of increase slowed in 2025, CO₂ continues to accumulate in the atmosphere. The total concentration reached 427 ppm, a 35% increase from 1960.
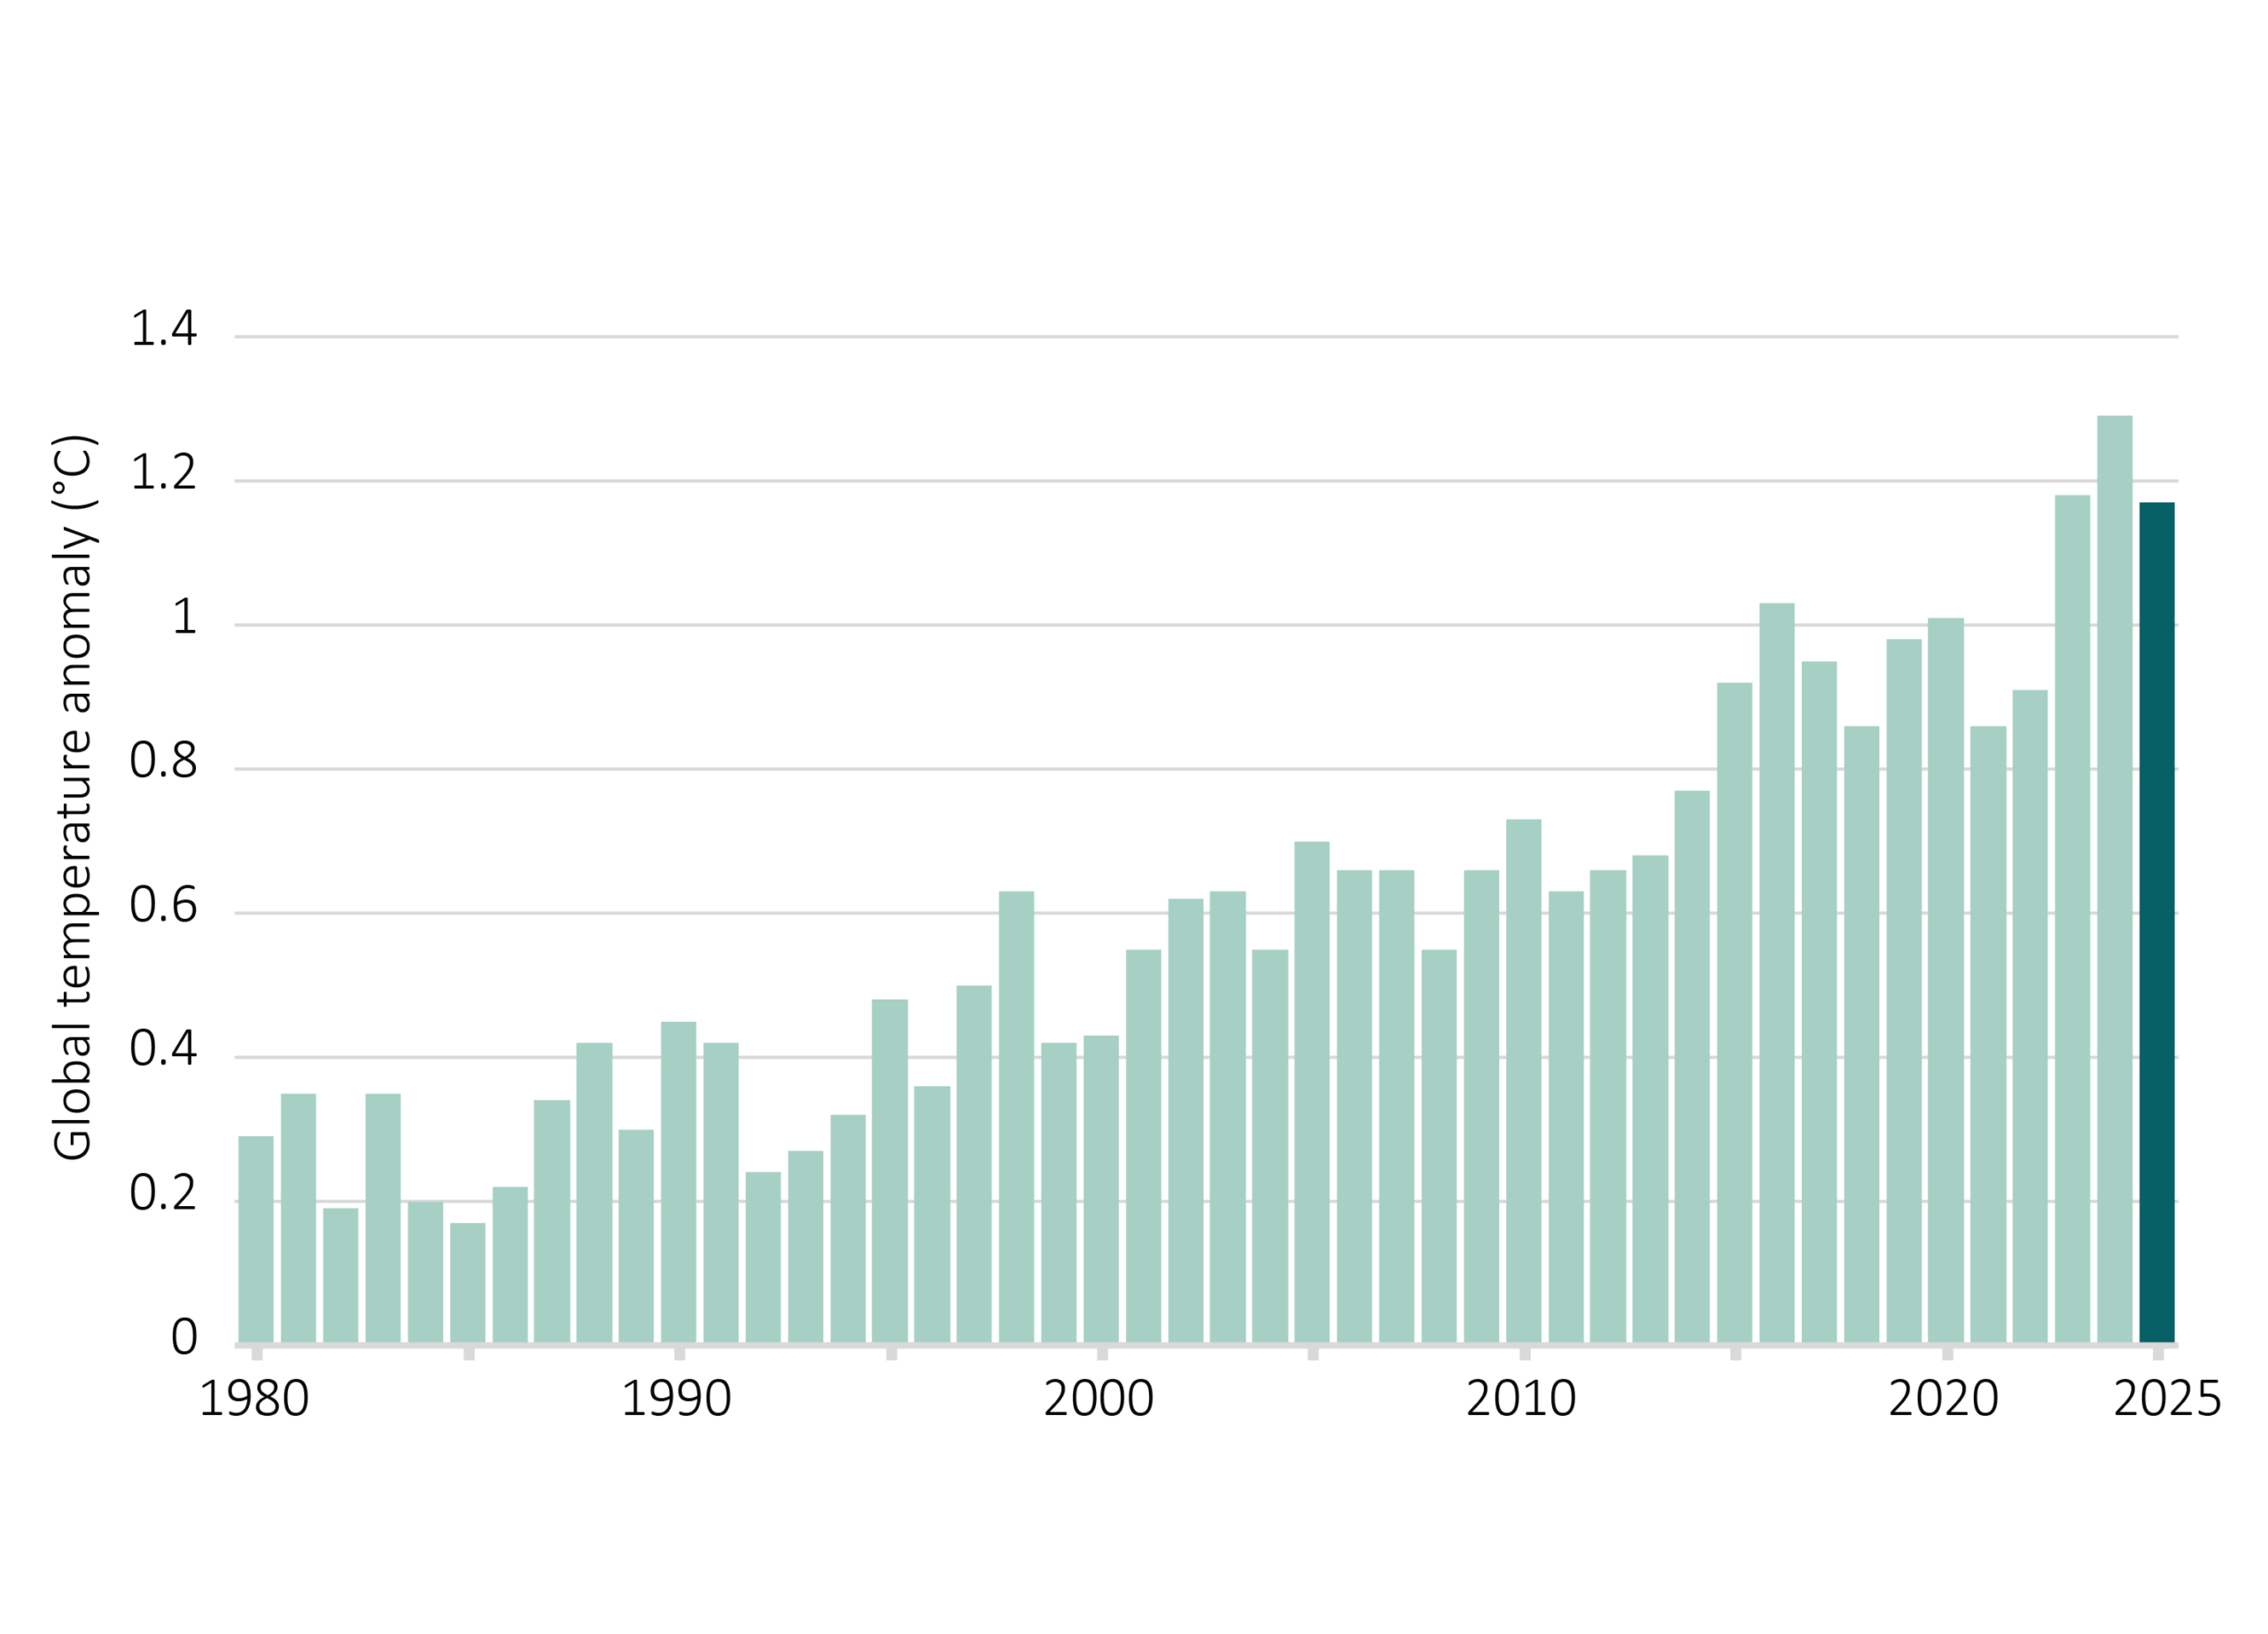
Global average air temperature was the third highest on record, 0.12°C lower than the previous record year. The modest cooling reflects the shift from El Niño’s warming influence to a weak La Niña in 2025. Temperature was 1.17°C above the 20th- century average and 1.48°C above the pre- industrial average. The last three years rank as the hottest on record globally.
The maximum ozone hole extent was very similar to the previous year (2% larger), 7% smaller than the 2000–2024 average and 23% smaller than the maximum observed in 2000. Year-to-year variation is largely driven by winter weather patterns over Antarctica: unusually mild conditions in August 2025 disrupted the extreme cold needed to trigger ozone destruction. While the hole has not shrunk over the last two decades, it appears to have stabilised. Underlying chemical recovery is slow and obscured by natural year-to-year variation.
The two polar regions changed in opposite directions in 2025. Arctic sea ice extent was 2.5% less than the previous year and reached a record low driven by high winter temperatures and unusual wind patterns. By contrast, Antarctic extent was 1.6% greater than the previous year but has remained below historical values since around 2016. Combined ice extent was near identical to the previous year but still the second-lowest since satellite records began in 1978, and 7% below the 2000–2024 average.
Where does this data come from?
Measures of the condition of natural resources and ecosystems were derived from several spatial data sources.
Weather data was derived by combining station satellite and weather forecast model data.
Data on land cover, inundation, fire, soil condition and vegetation leaf area were derived by automated interpretation of satellite imagery. Biodiversity analysis was based on the DCCEEW SPRAT database and Threatened Species Index (TSX), providing measures of change in the relative abundance of Australia's threatened and near-threatened species at national and regional levels.
The other indicators were estimated by combining the weather and satellite data in ANU's environmental data assimilation system, OzWALD.
For further details on data and methods or to download the data, read more.