
 Weather
Key points
- 2025 was characterised by above-average temperatures with the north experiencing one of its wettest years in decades while the south endured a third year of low winter rainfall.
Rainfall
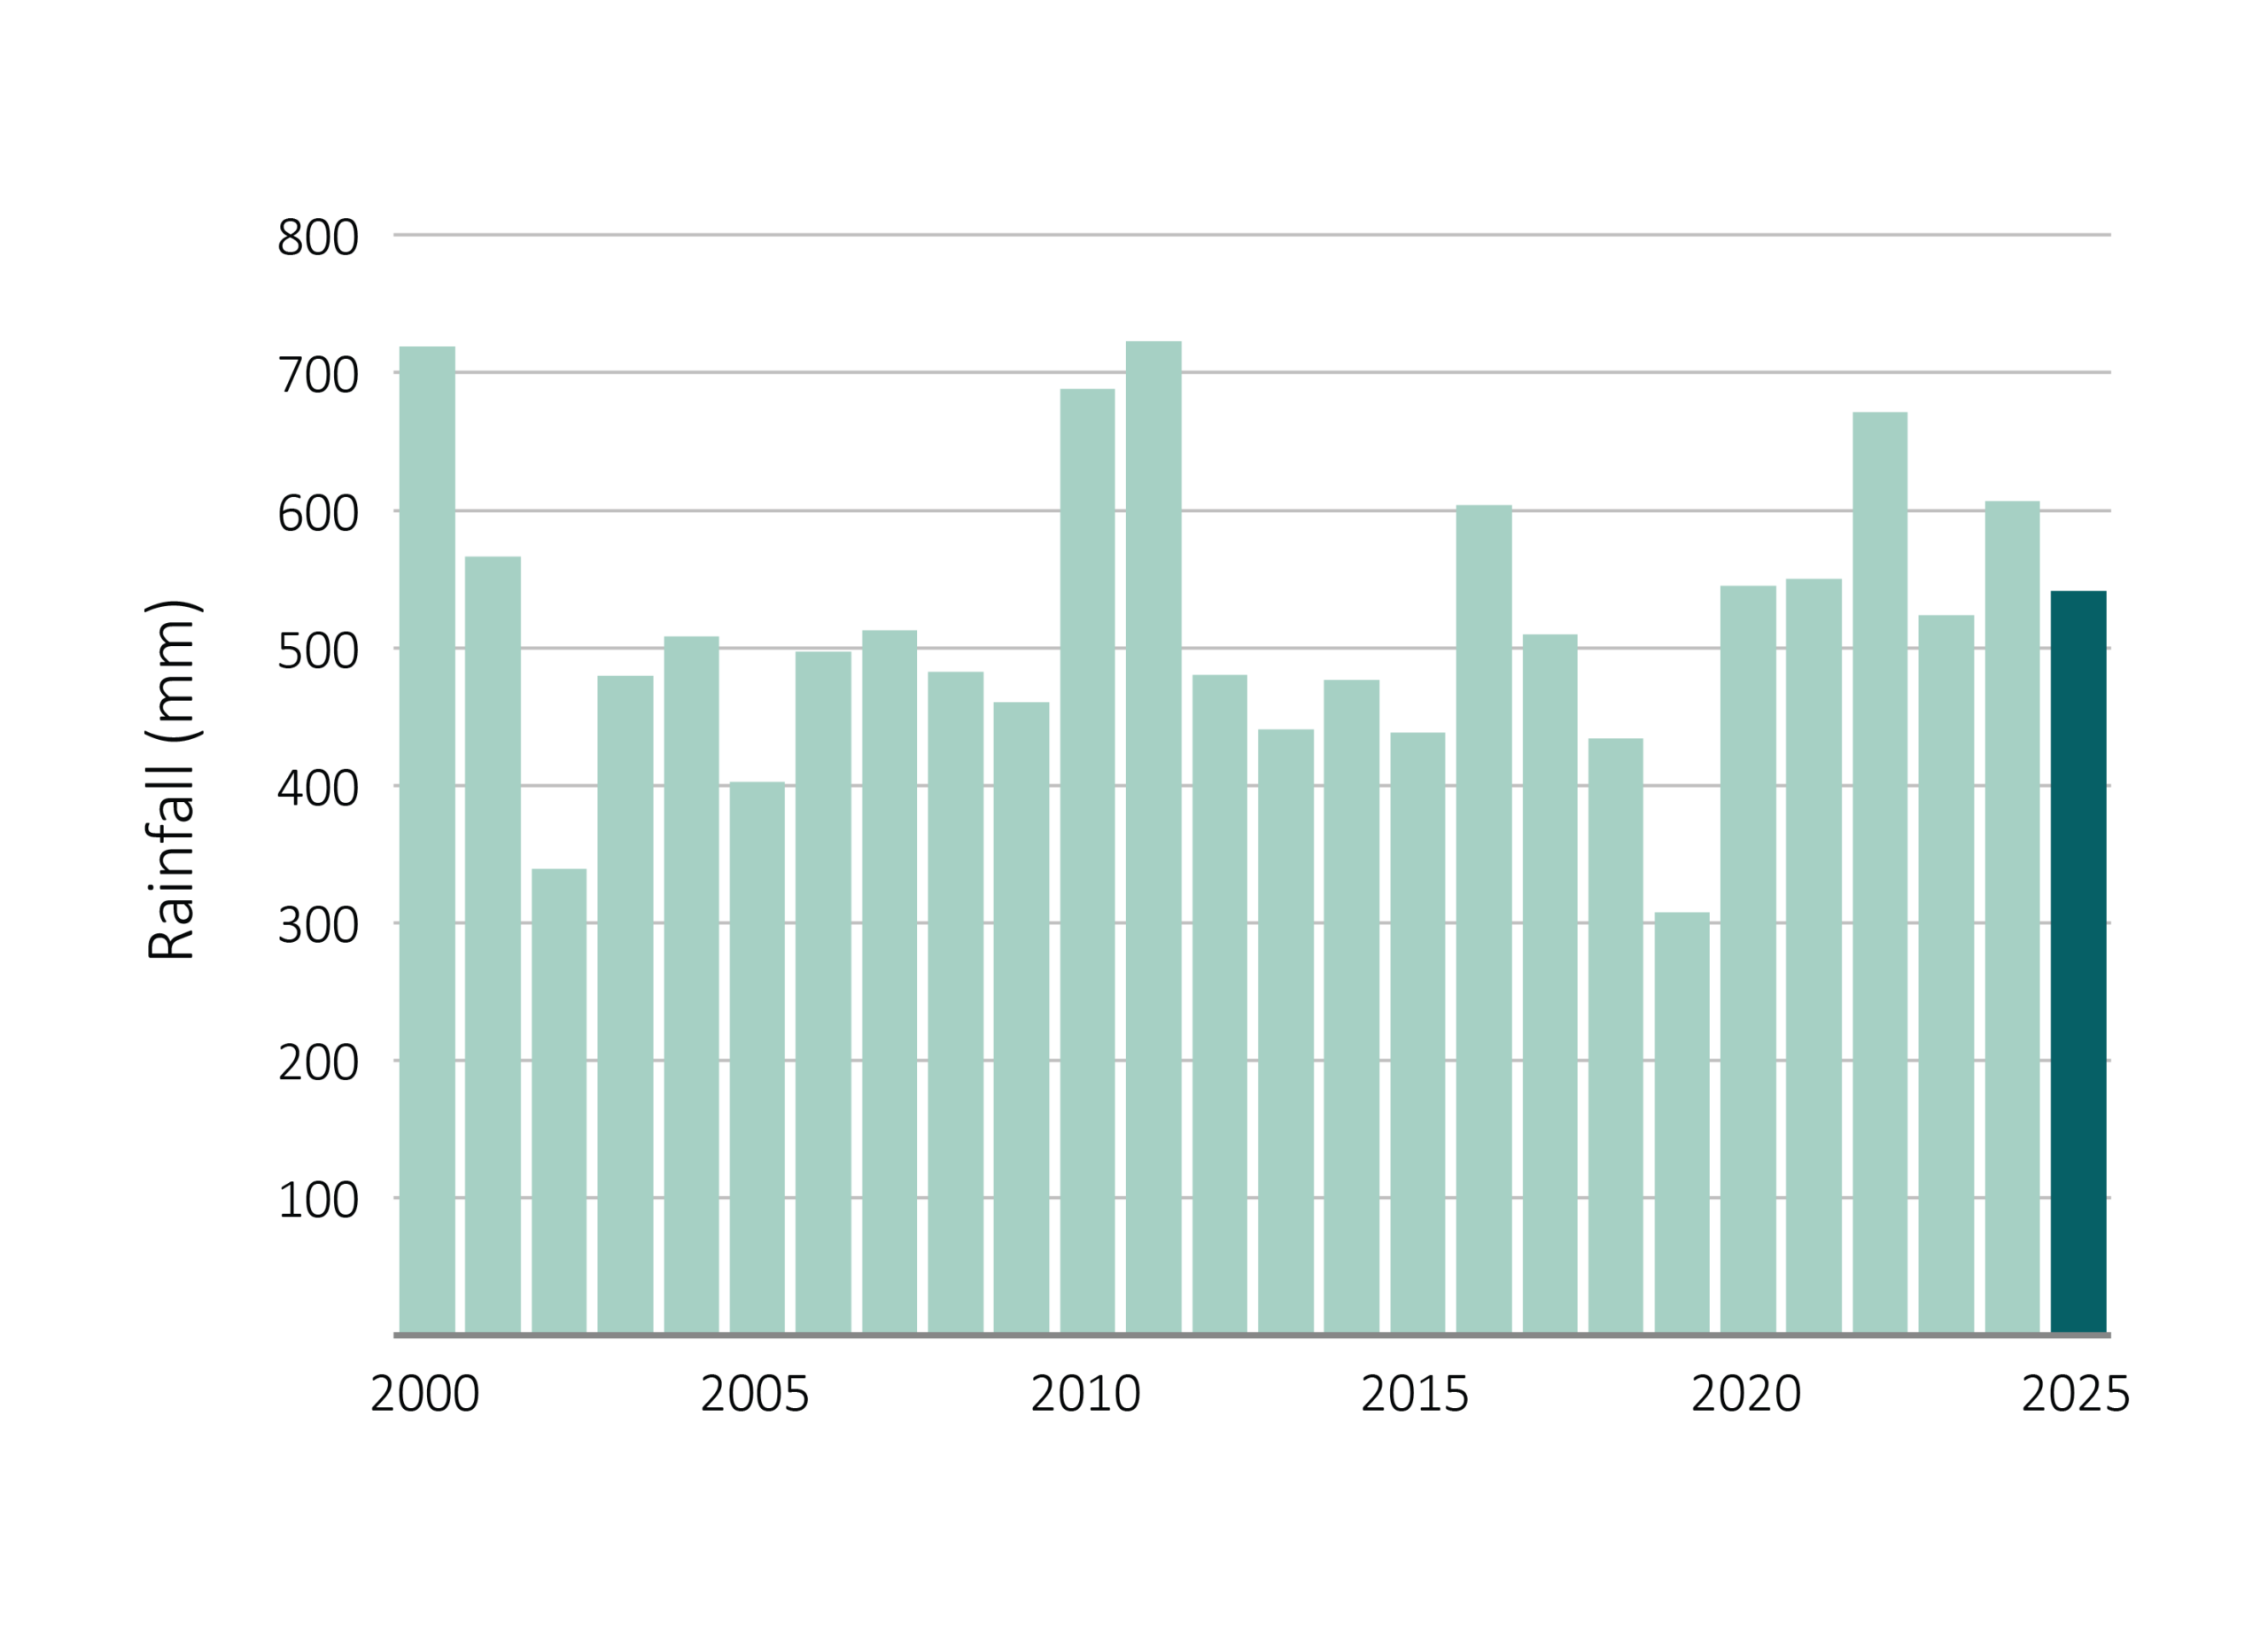
National average rainfall was 538 mm, 4% higher than the 2000–2024 average. Rainfall was above average across much of Queensland — the highest since 2011 — and in parts of the Northern Territory and north-western Western Australia, while below average across most of Victoria, Tasmania and South Australia, much of inland New South Wales and large parts of southern Western Australia. South Australia experienced its driest year since 2019.
Nationally, rainfall was above average in March, April, July and August, and again in November and December. January was notably dry. The monsoon onset at Darwin was the latest since records began in 1957.
Temperature
Annual average temperature across Australia was the fourth-highest on record, continuing an increasing trend in line with global warming. The national average temperature was 0.47°C above the 2000–2024 average and 1.23°C above the 1961–1990 average.
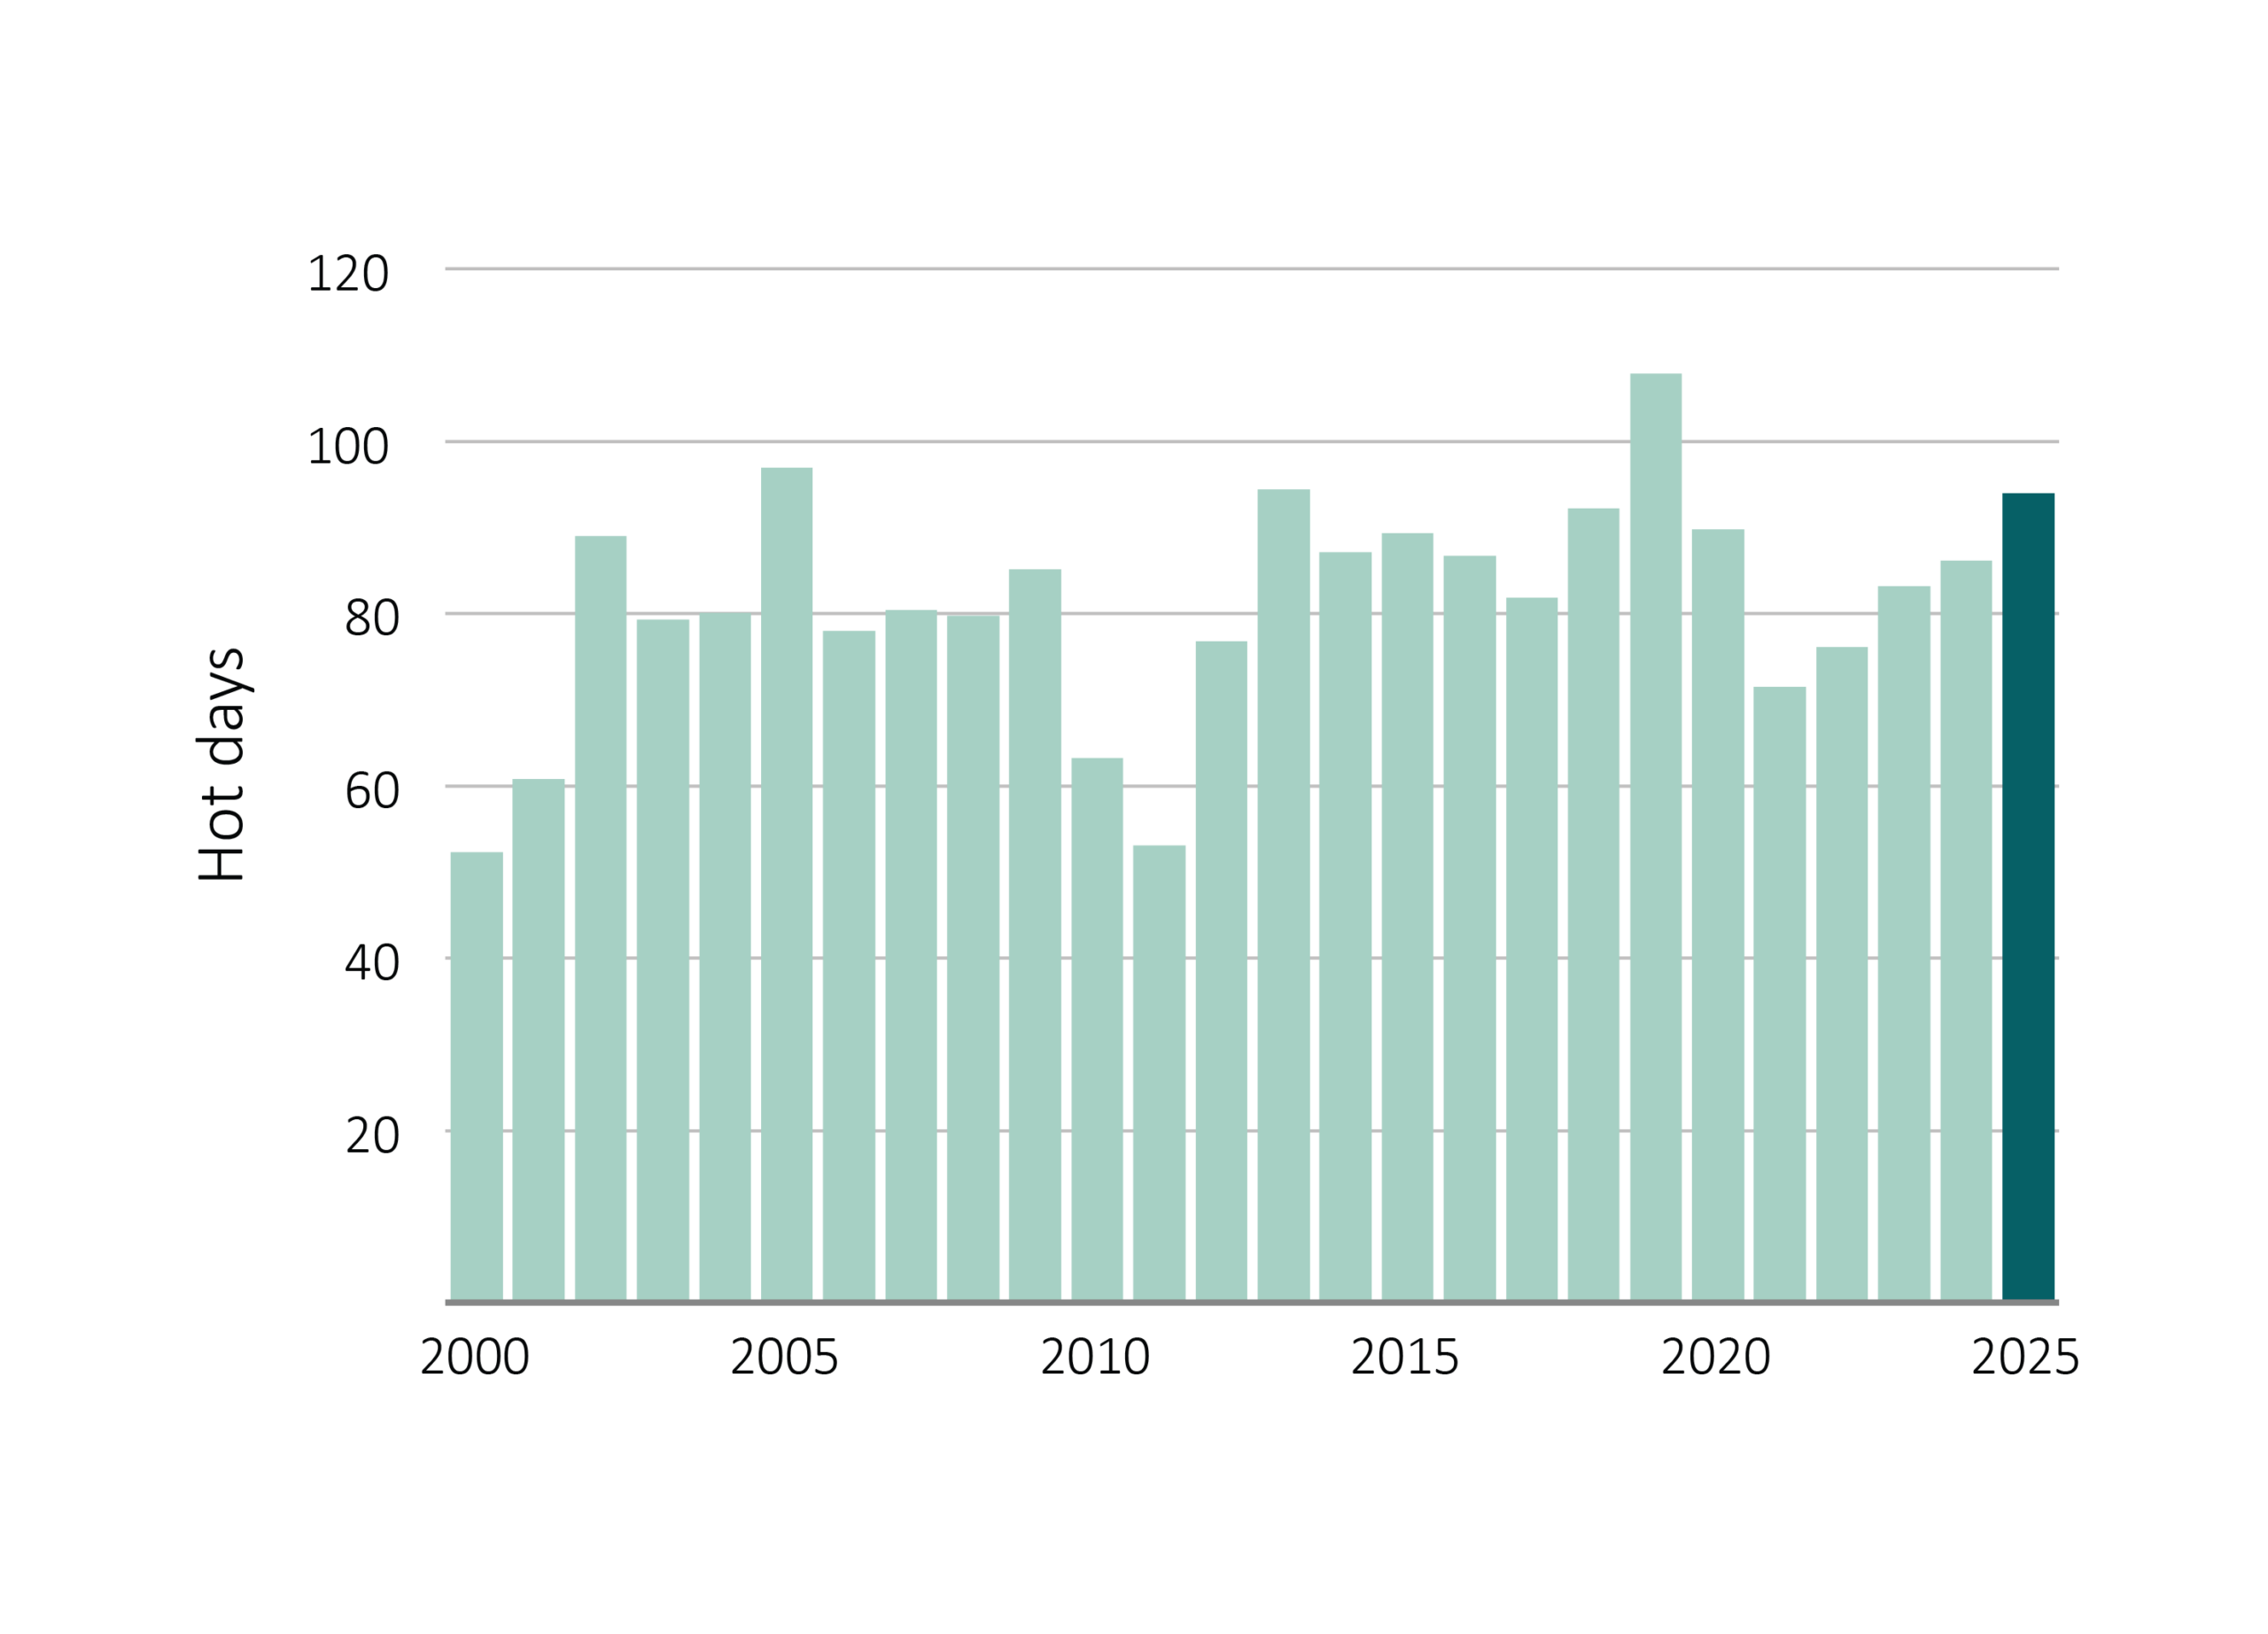
The average maximum temperature in 2025 was 42.4°C, 0.10°C higher than the previous year and 0.48°C above the 2000–2024 average. Hot days were more frequent than in 2024, with the national average of 94 hot days being 16% — or 13 days — above the 2000–2024 average, the highest since 2019.
Nights were slightly warmer than the previous year. The national average minimum temperature of 3.1°C was 0.30°C above 2024, though still 0.33°C below the 2000–2024 average, reflecting a relatively cold June — the coldest national minimum since 2017. The average number of frost days was close to both the previous year and the 2000–2024 average.
Snow cover more than doubled compared to 2024, which had been the lowest on record. At 23% above the 2000–2024 average, 2025 represented a recovery from that exceptional low rather than an indication of a broader trend.
Where does this data come from?
Measures of the condition of natural resources and ecosystems were derived from several spatial data sources.
Weather data was derived by combining station satellite and weather forecast model data.
Data on land cover, inundation, fire, soil condition and vegetation leaf area were derived by automated interpretation of satellite imagery. Biodiversity analysis was based on the DCCEEW SPRAT database and Threatened Species Index (TSX), providing measures of change in the relative abundance of Australia's threatened and near-threatened species at national and regional levels.
The other indicators were estimated by combining the weather and satellite data in ANU's environmental data assimilation system, OzWALD.
For further details on data and methods or to download the data, read more.