
 Soils
Soils
Key points
- Soil moisture declined from the previous year but remained above the long-term average. Soil surface protection was among the best on record.
Soil moisture
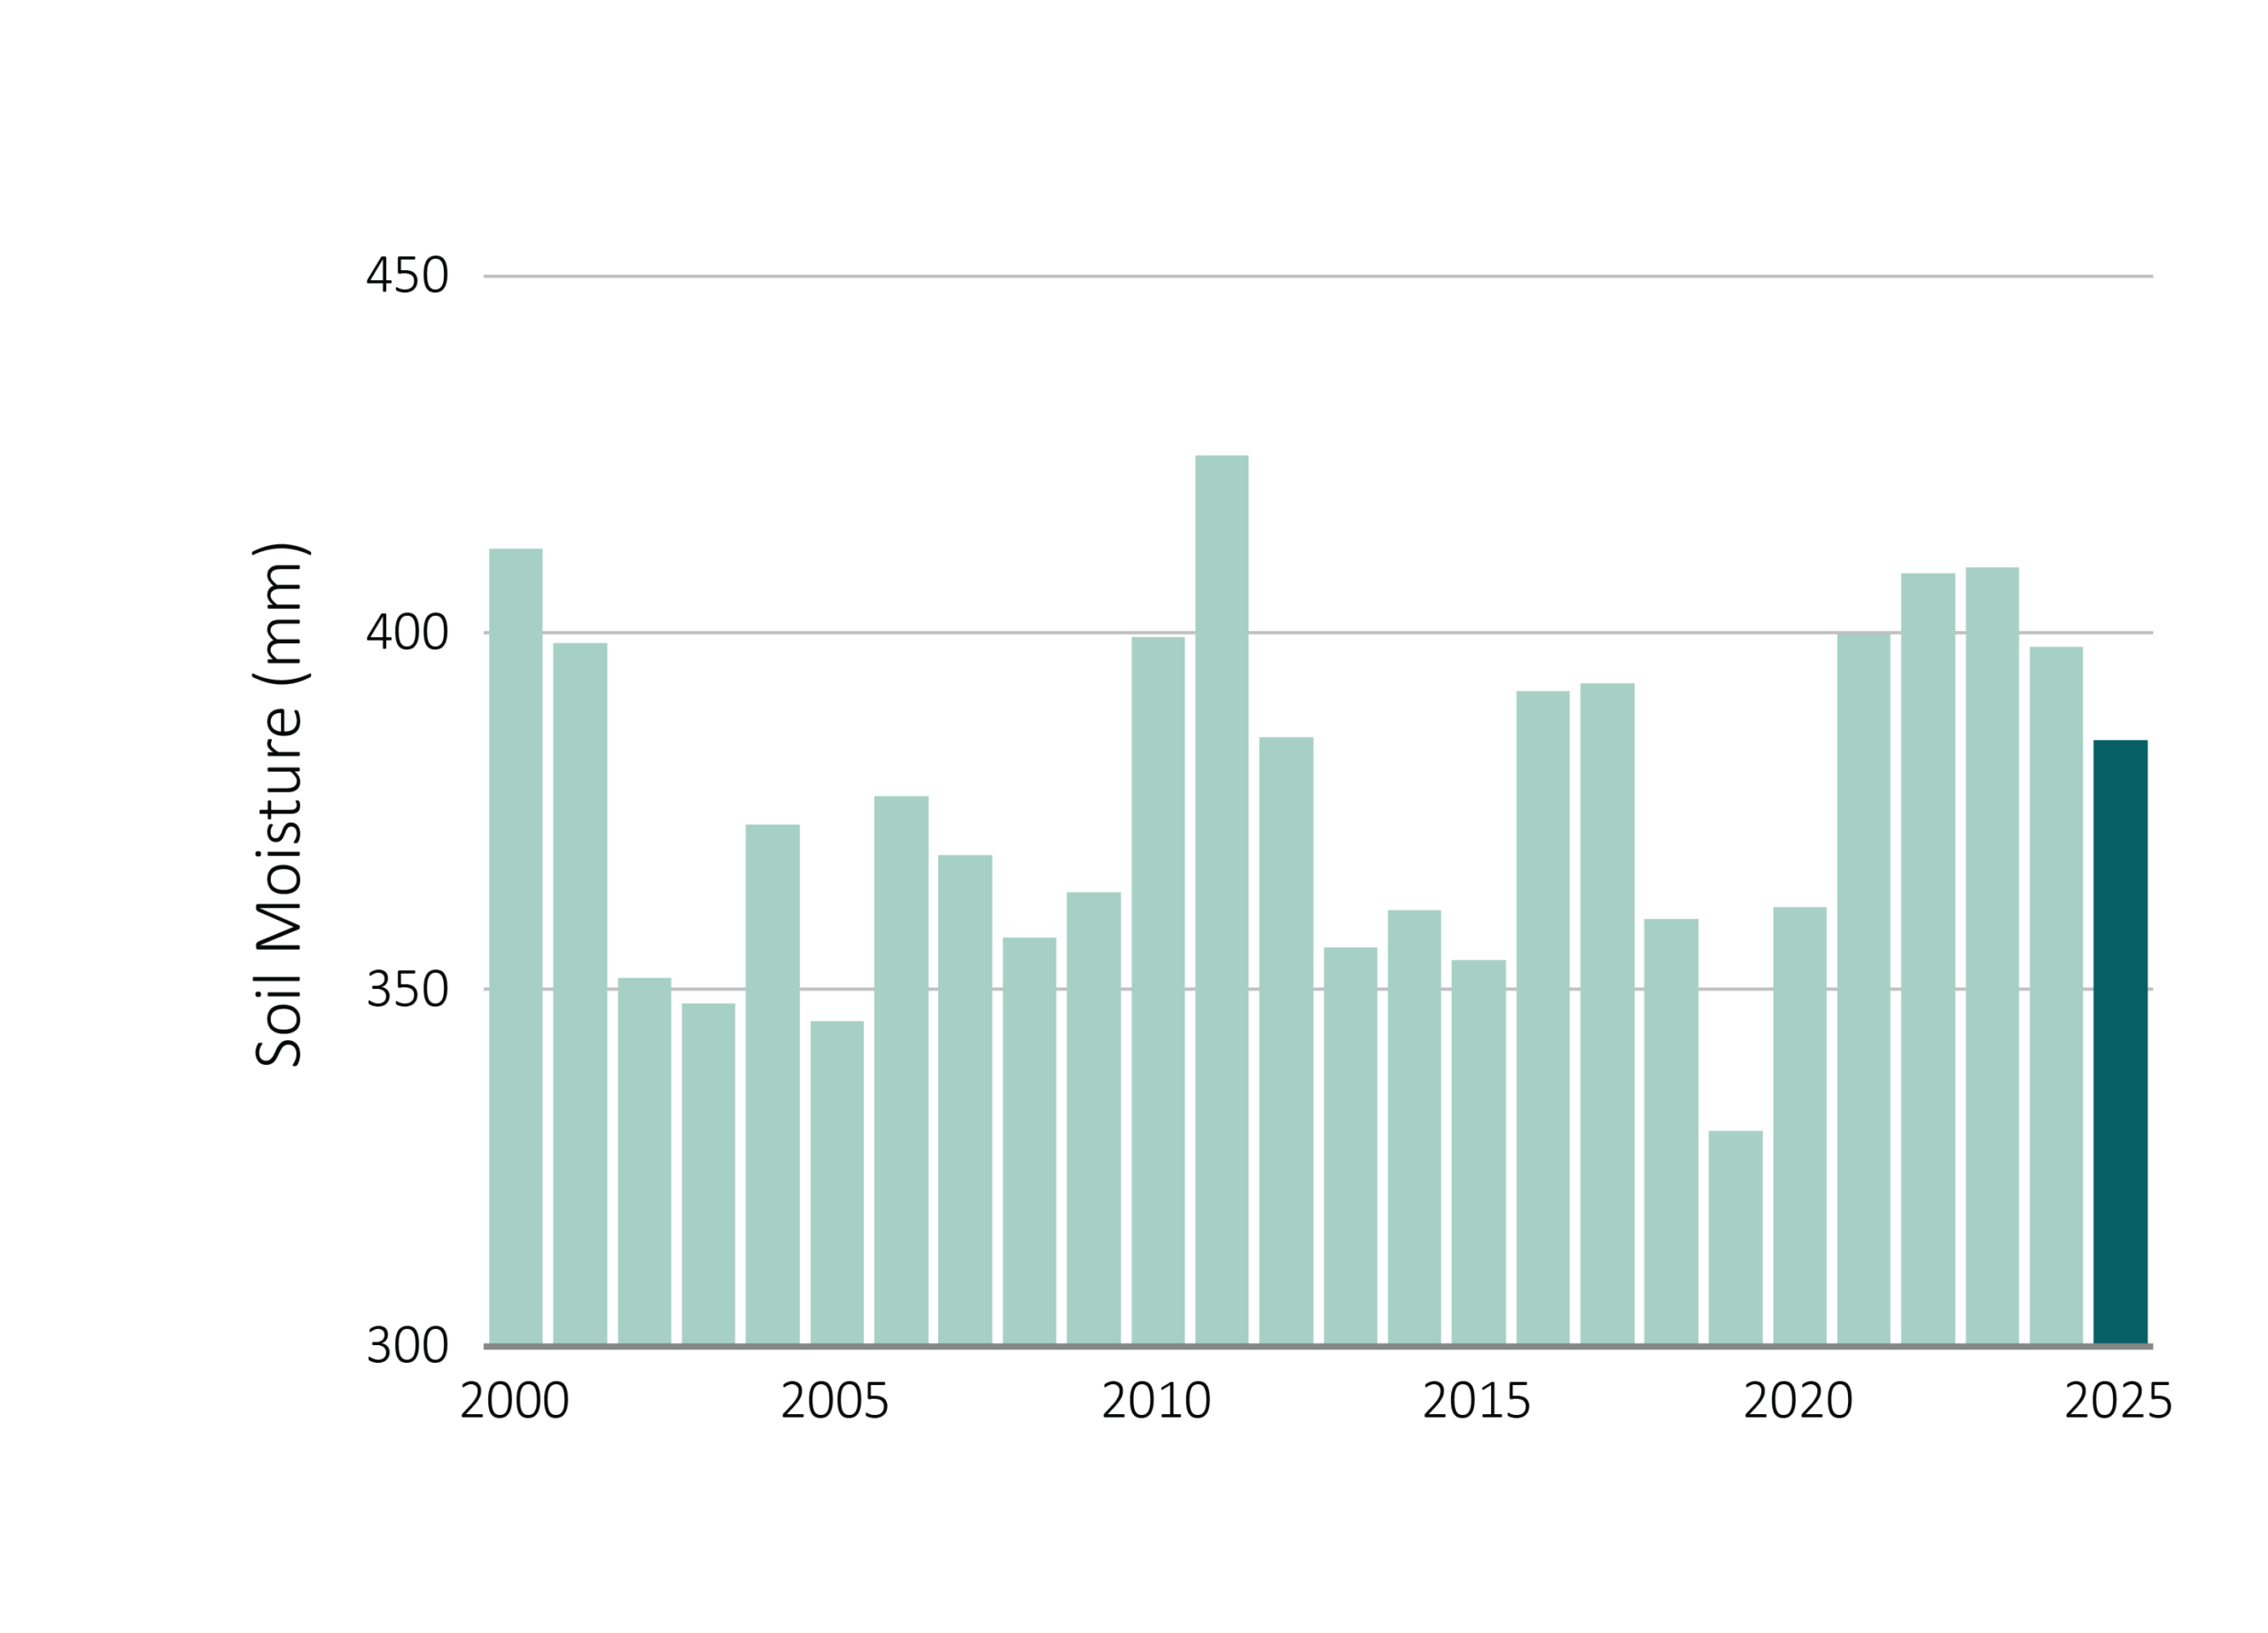
National average soil moisture in 2025 was 385 mm — 13 mm or 3% less than 2024 but still 2% above the 2000–2024 average. This follows four consecutive above-average years and represents the eighth-highest value since 2000.
Soil moisture was highest on record for the 2000–2025 period across coasts and ranges of central and northern NSW, consistent with above-average rainfall in those catchments. Above-average conditions also extended across parts of northern Queensland and the NT Top End. By contrast, soil moisture was the lowest on record across south-west WA and much of southern and central SA, with very low conditions extending into western Victoria, parts of the SA-Victoria border region and Tasmania — consistent with three consecutive years of below-average winter rainfall.
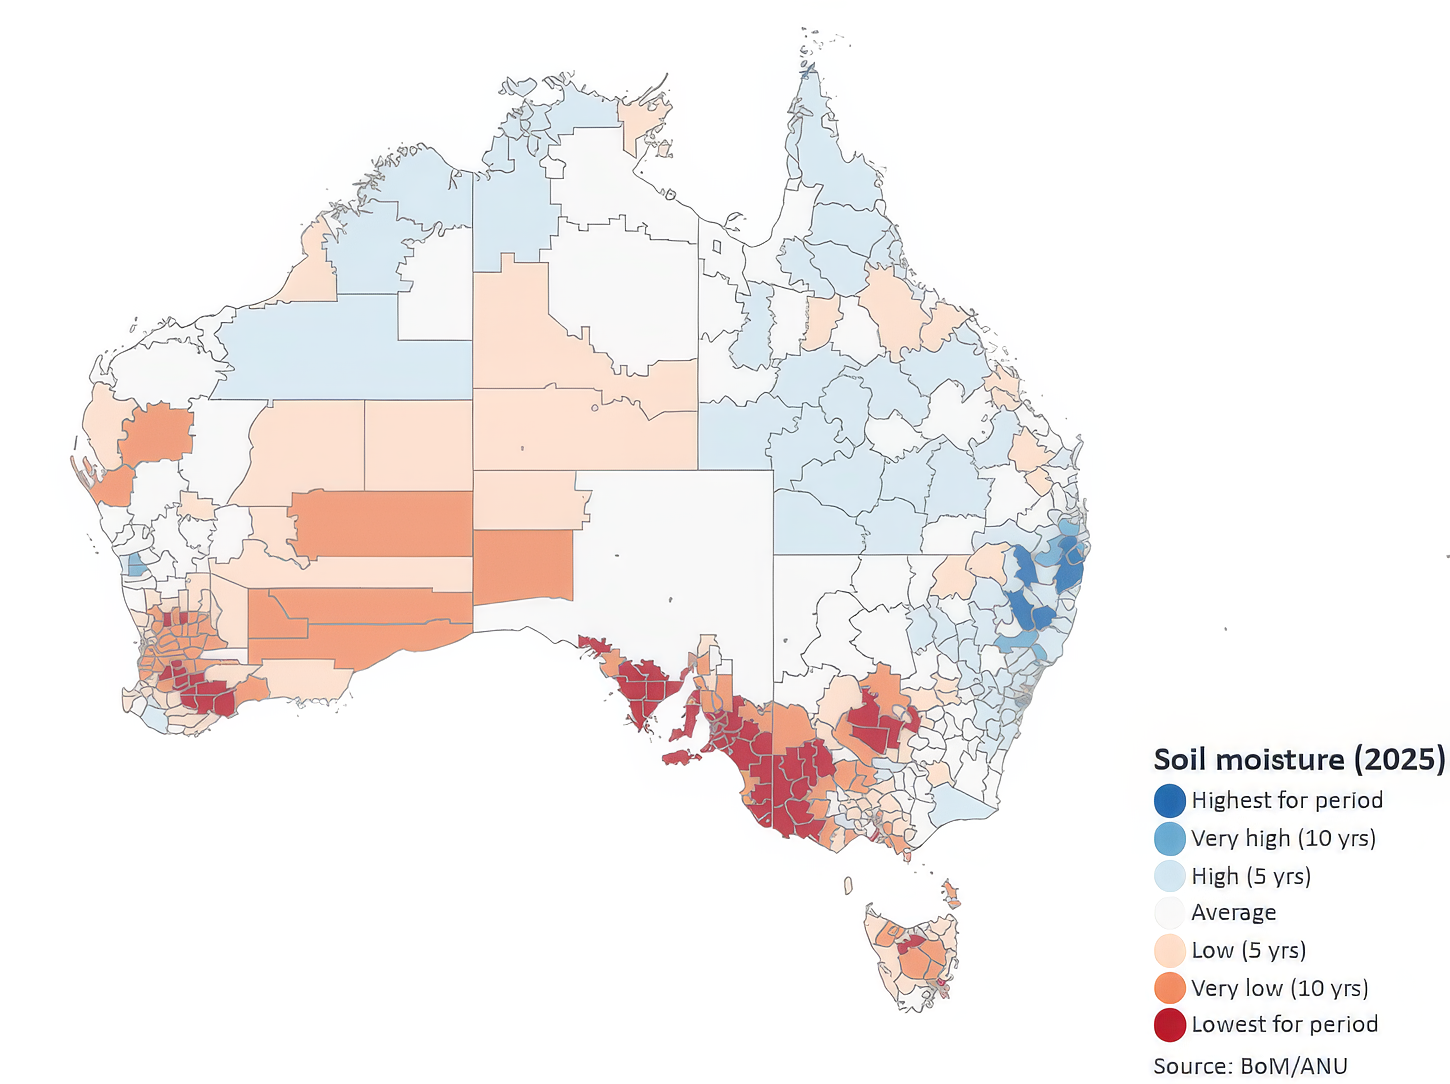
Nationally, soil moisture increased until April but then declined through the rest of the year, recovering from November onwards with the onset of the northern wet season. Different patterns occurred in western Victoria and Tasmania, which experienced dry conditions until June, and much of the year, and NSW, which experienced relatively wet conditions until September, though with regional contrasts.
Exposed Soil
Despite the decline in moisture, soil surface protection remained excellent. The proportion of exposed soil — bare ground unprotected by vegetation or leaf litter — was 33%, unchanged from 2024 and 9.5% below the 2000–2024 average, the fourth-lowest since 2000. Soil surface protection was excellent across most of Australia, with exposed soil at record low-levels across much of northern Australia, coastal and eastern Queensland and parts of NSW. Conditions were near-average across much of inland WA and central SA. The exception was a concentrated area in south- west WA, where soil exposure reached record high, reflecting the cumulative impact of long- term rainfall decline and vegetation stress in that region.

The contrast between declining soil moisture in the south and well above-average vegetation cover nationally reflects the legacy of a series of wet years, particularly in the north and east. In southern Australia, the combination of declining soil moisture and below-average rainfall for three winters could present an increasing risk of soil degradation and reduced landscape resilience.
Where does this data come from?
Measures of the condition of natural resources and ecosystems were derived from several spatial data sources.
Weather data was derived by combining station satellite and weather forecast model data.
Data on land cover, inundation, fire, soil condition and vegetation leaf area were derived by automated interpretation of satellite imagery. Biodiversity analysis was based on the DCCEEW SPRAT database and Threatened Species Index (TSX), providing measures of change in the relative abundance of Australia's threatened and near-threatened species at national and regional levels.
The other indicators were estimated by combining the weather and satellite data in ANU's environmental data assimilation system, OzWALD.
For further details on data and methods or to download the data, read more.