
 Summary Indicators
Key points
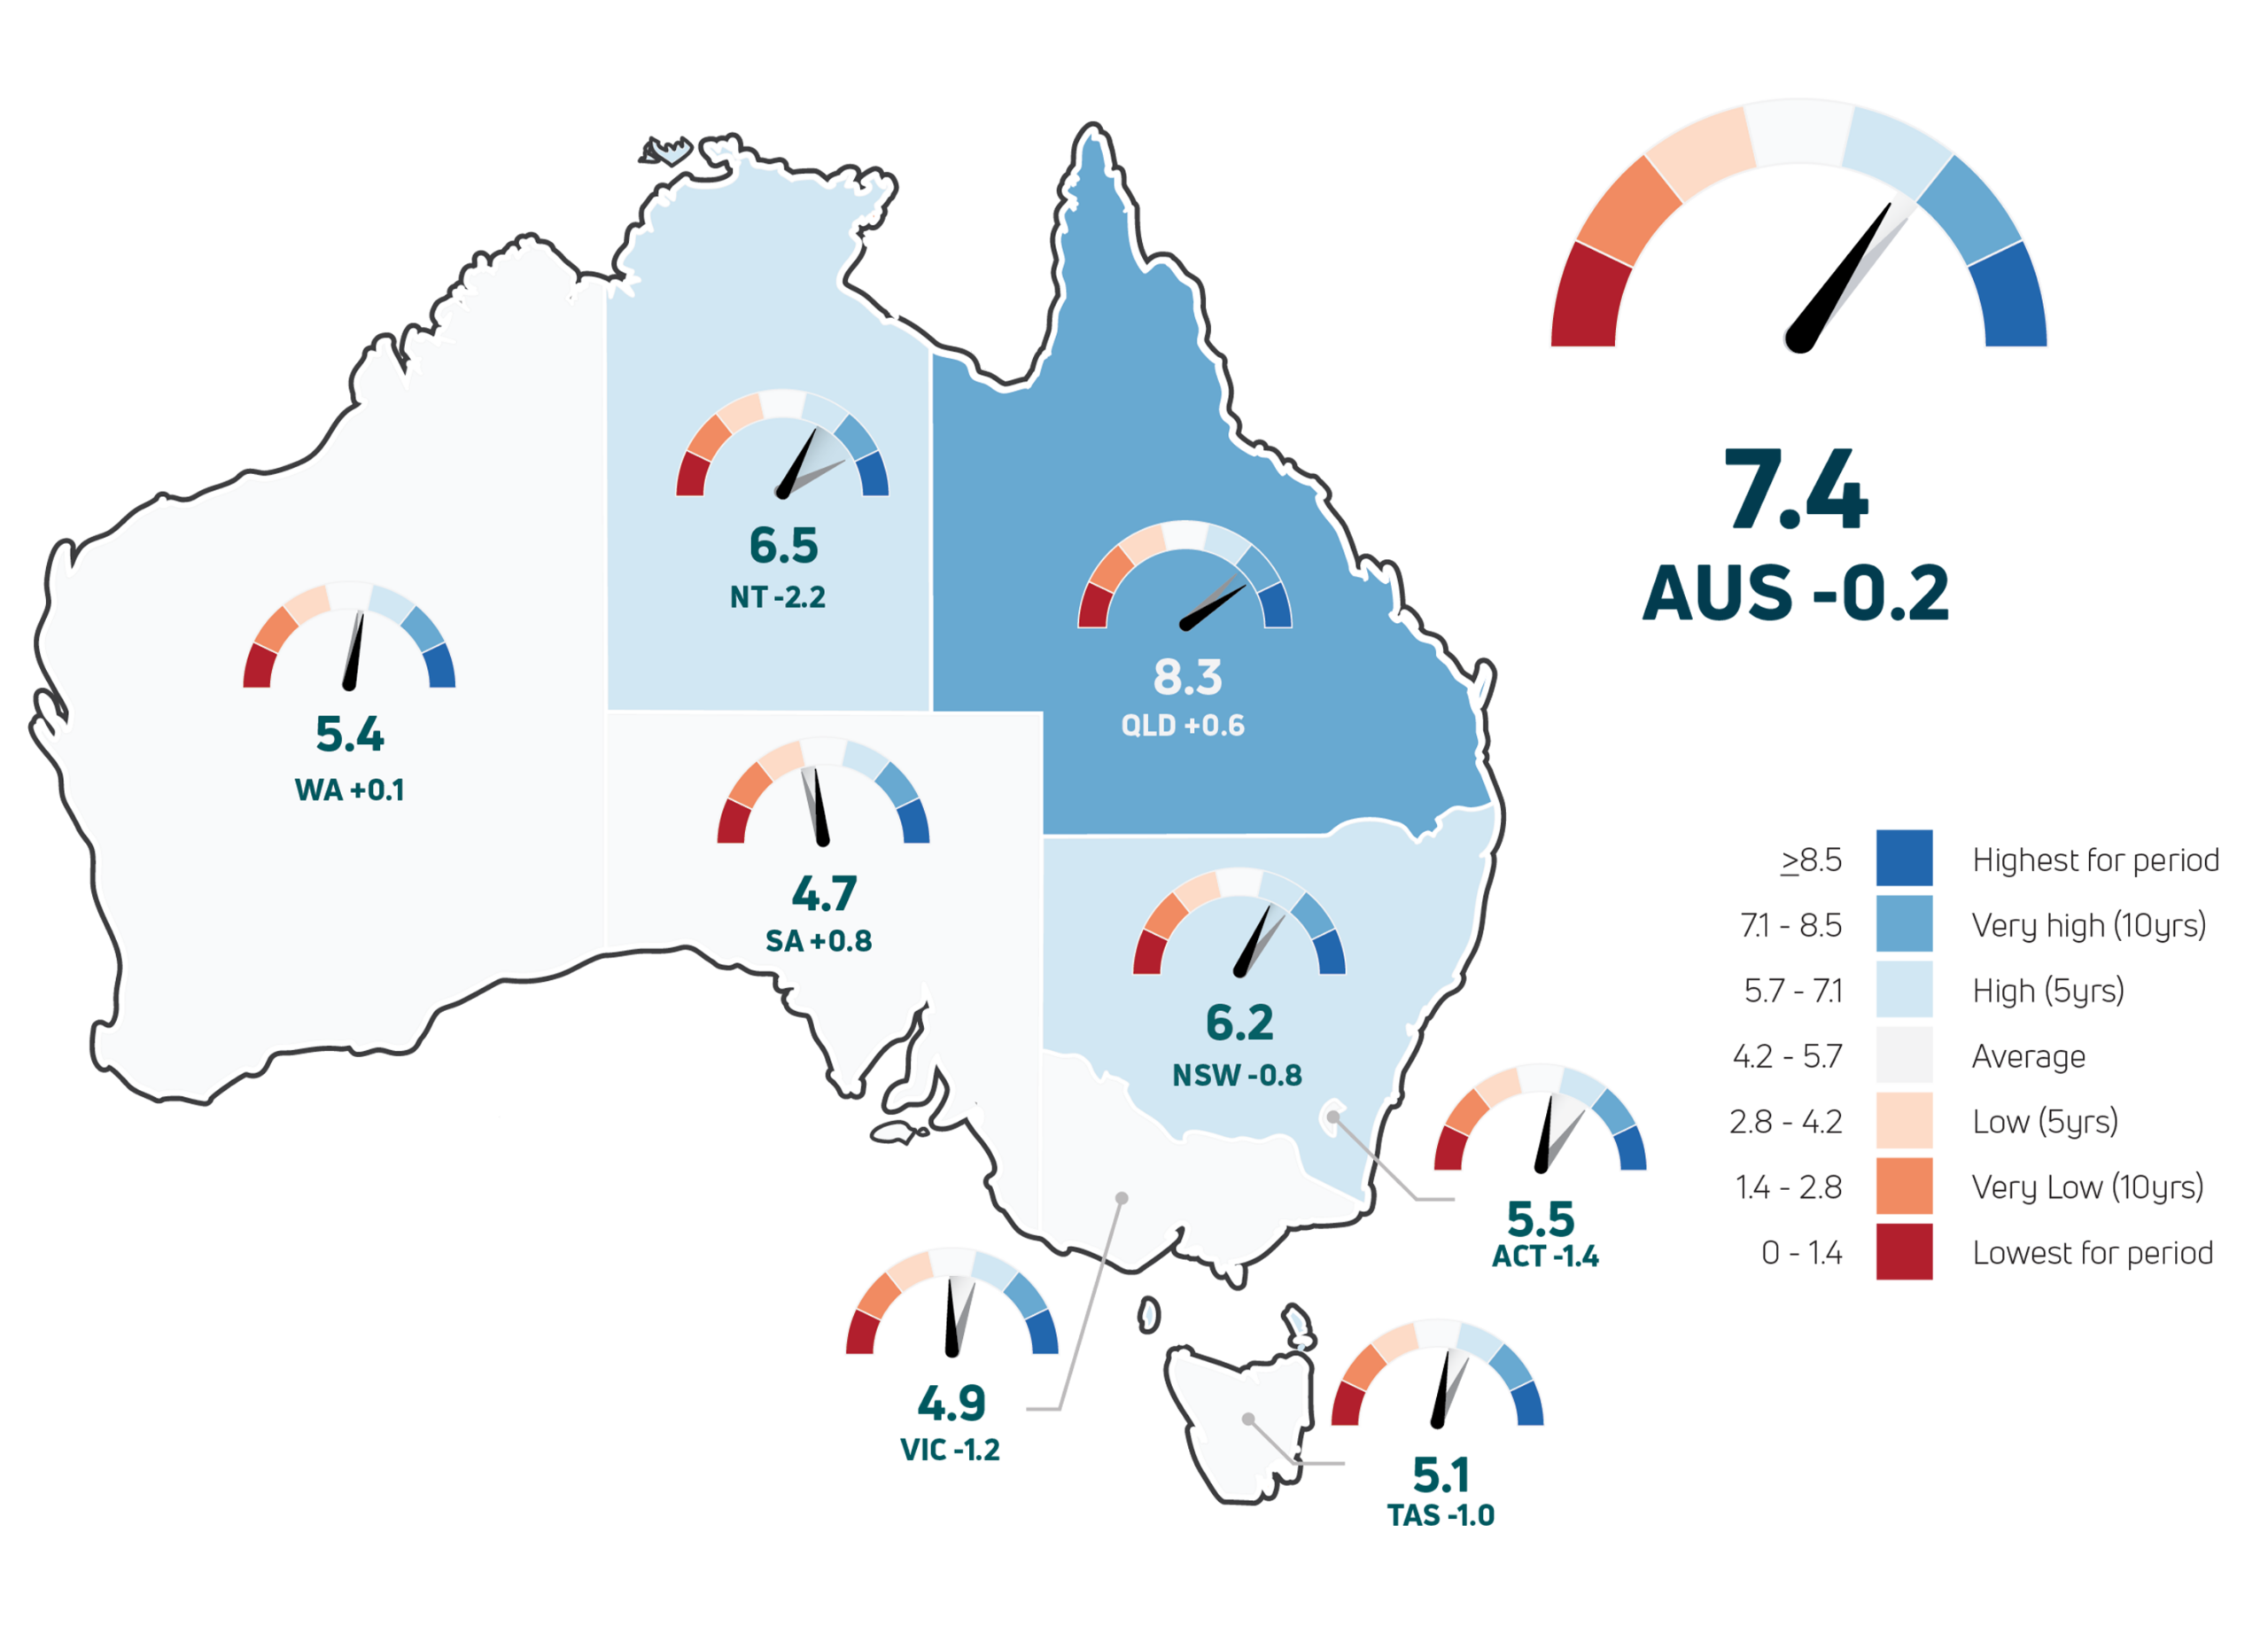
- Australia’s environmental condition remained above average for the fifth consecutive year, with a national Environmental Condition Score of 7.4 out of 10.
Environmental Condition Score (ECS)
The national Environmental Condition Score (ECS) fell by 0.2 points to 7.4 out of ten in 2025, though conditions remained above average for the fifth consecutive year.
ECS scores declined in most states and territories. The greatest declines were in the Northern Territory (from 8.7 to 6.5) and the ACT (from 7.2 to 5.5), with notable declines also in Tasmania (from 6.1 to 5.1) and Victoria (from 6.1 to 4.9).
South Australia and Western Australia bucked the 6.5 national trend, recording an improvement to 4.7 and no NT -2.2 change, respectively. Queensland recorded the largest increase, rising from 7.7 to 8.3.
What is the Environmental Condition Score?
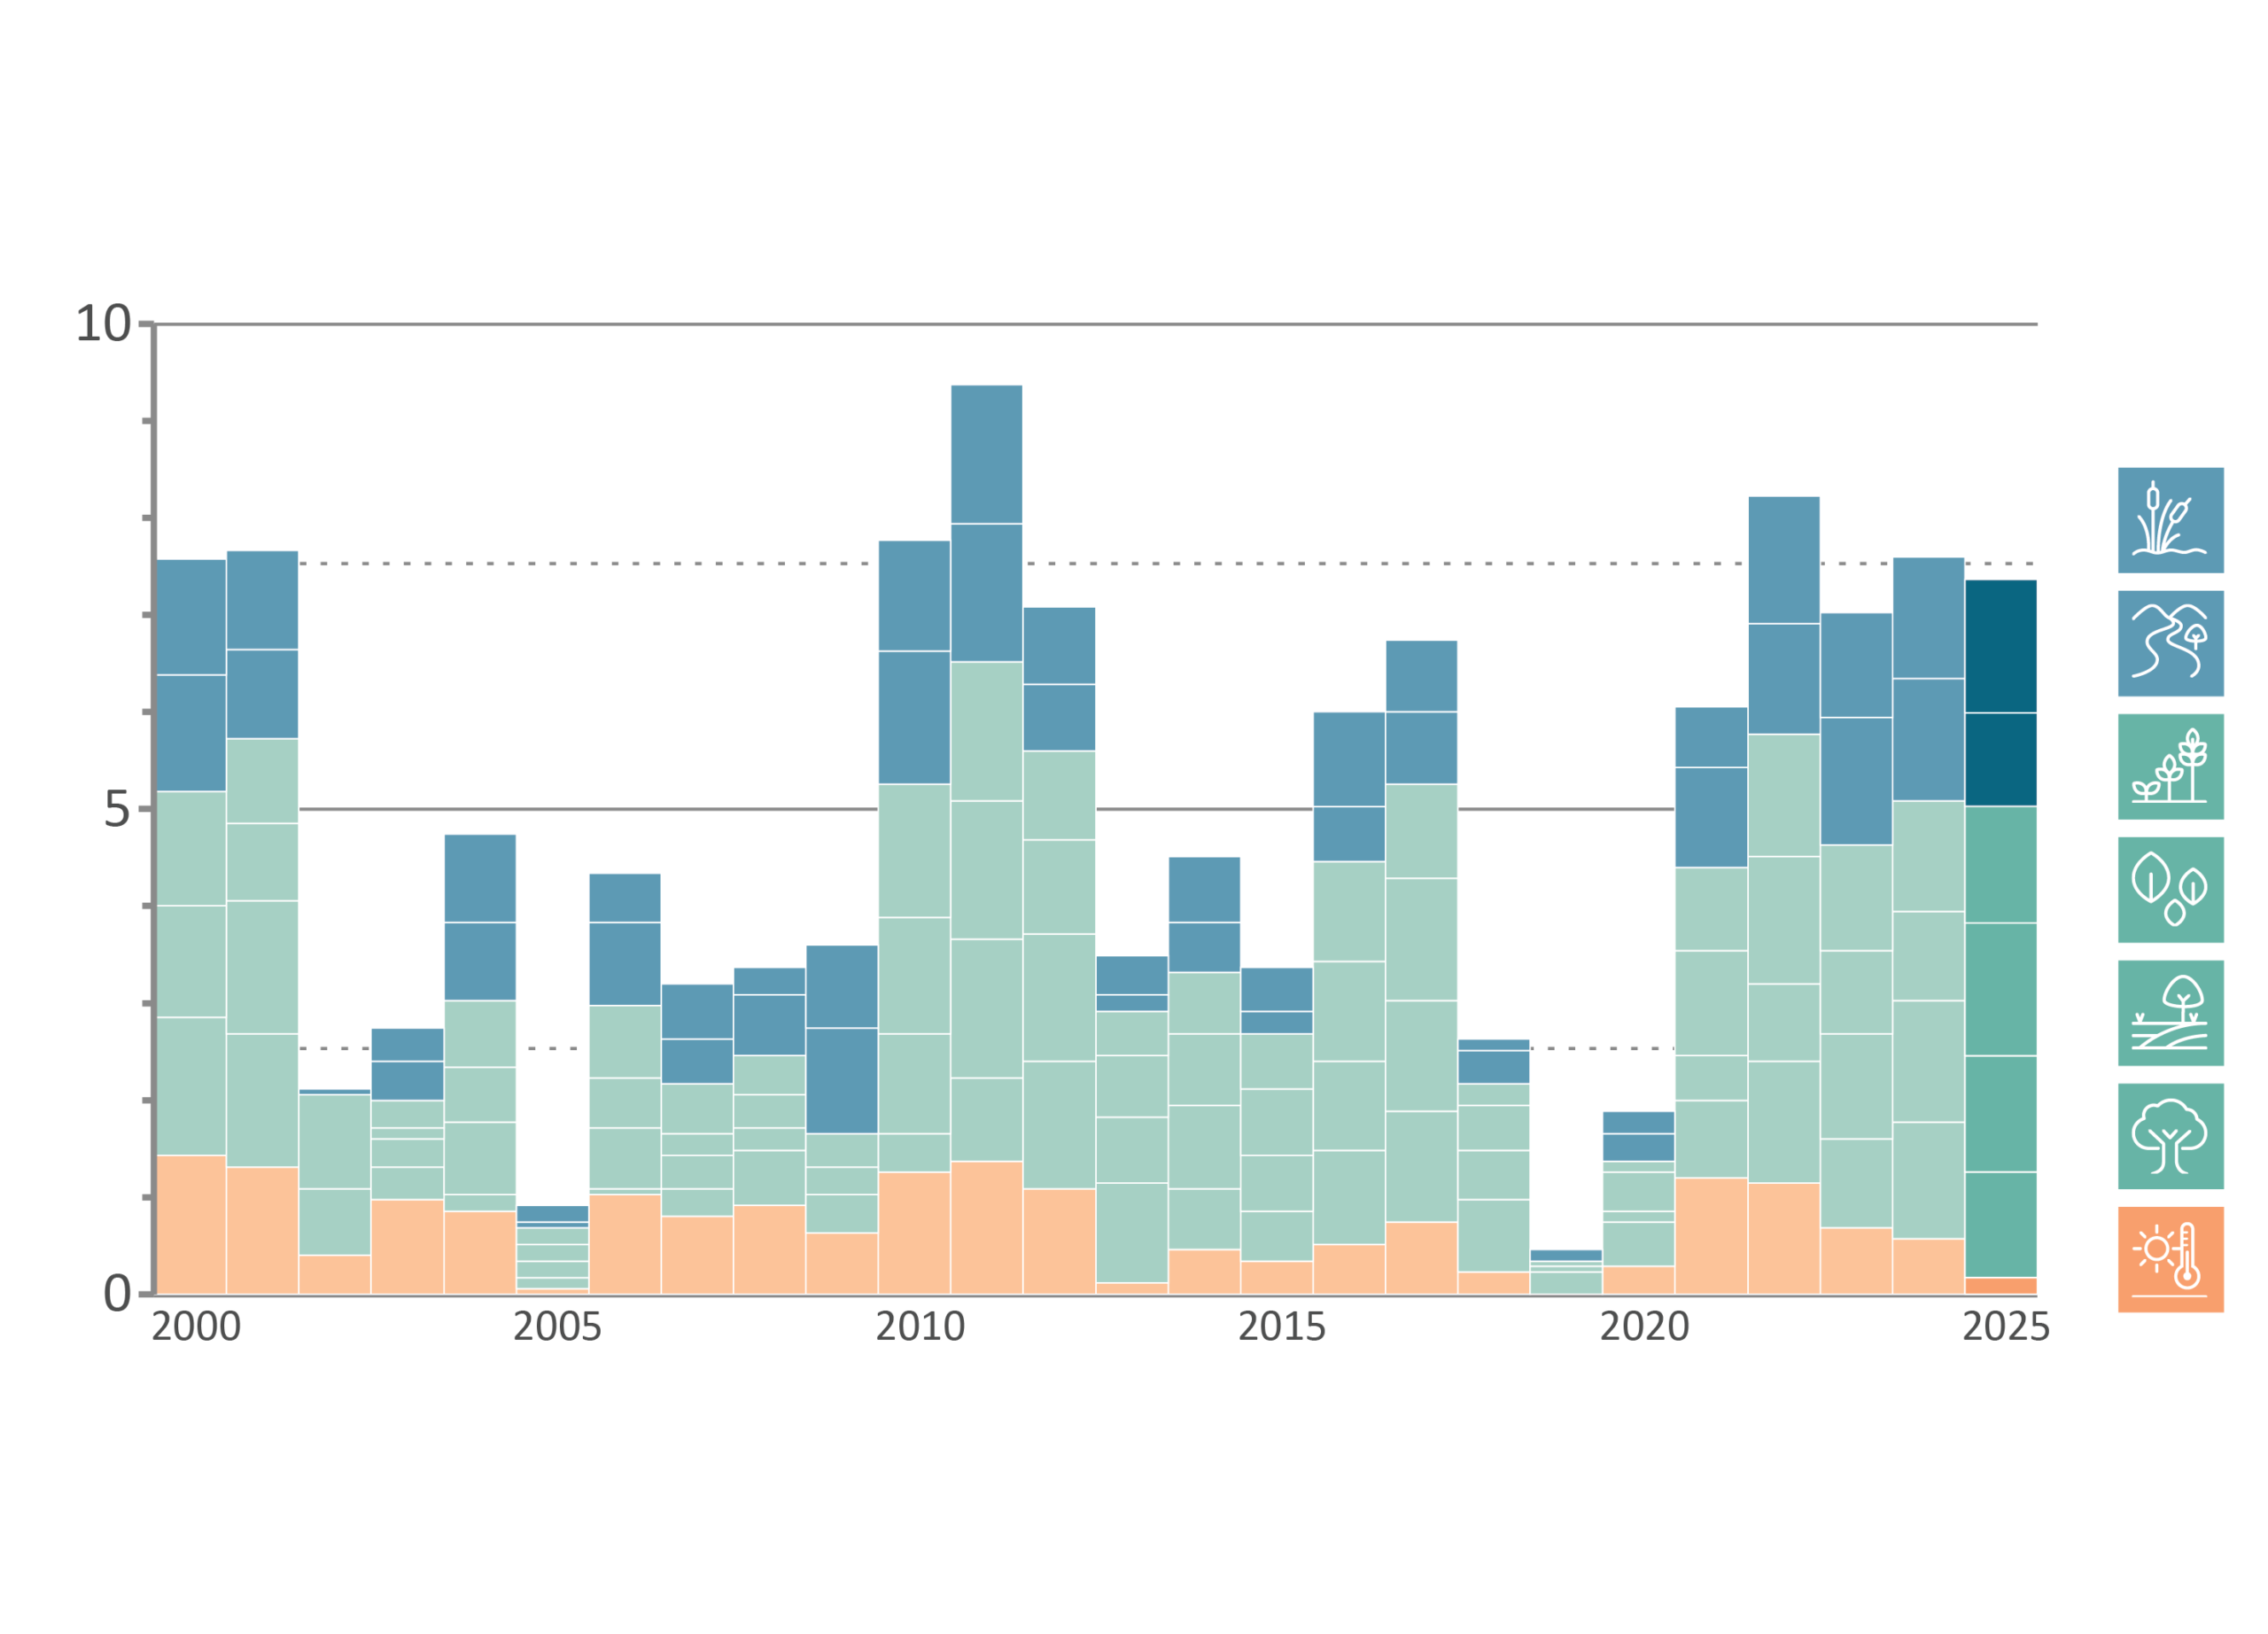
The Environmental Condition Score (ECS) is a score between 0 and 10 expressing condition relative to previous years.

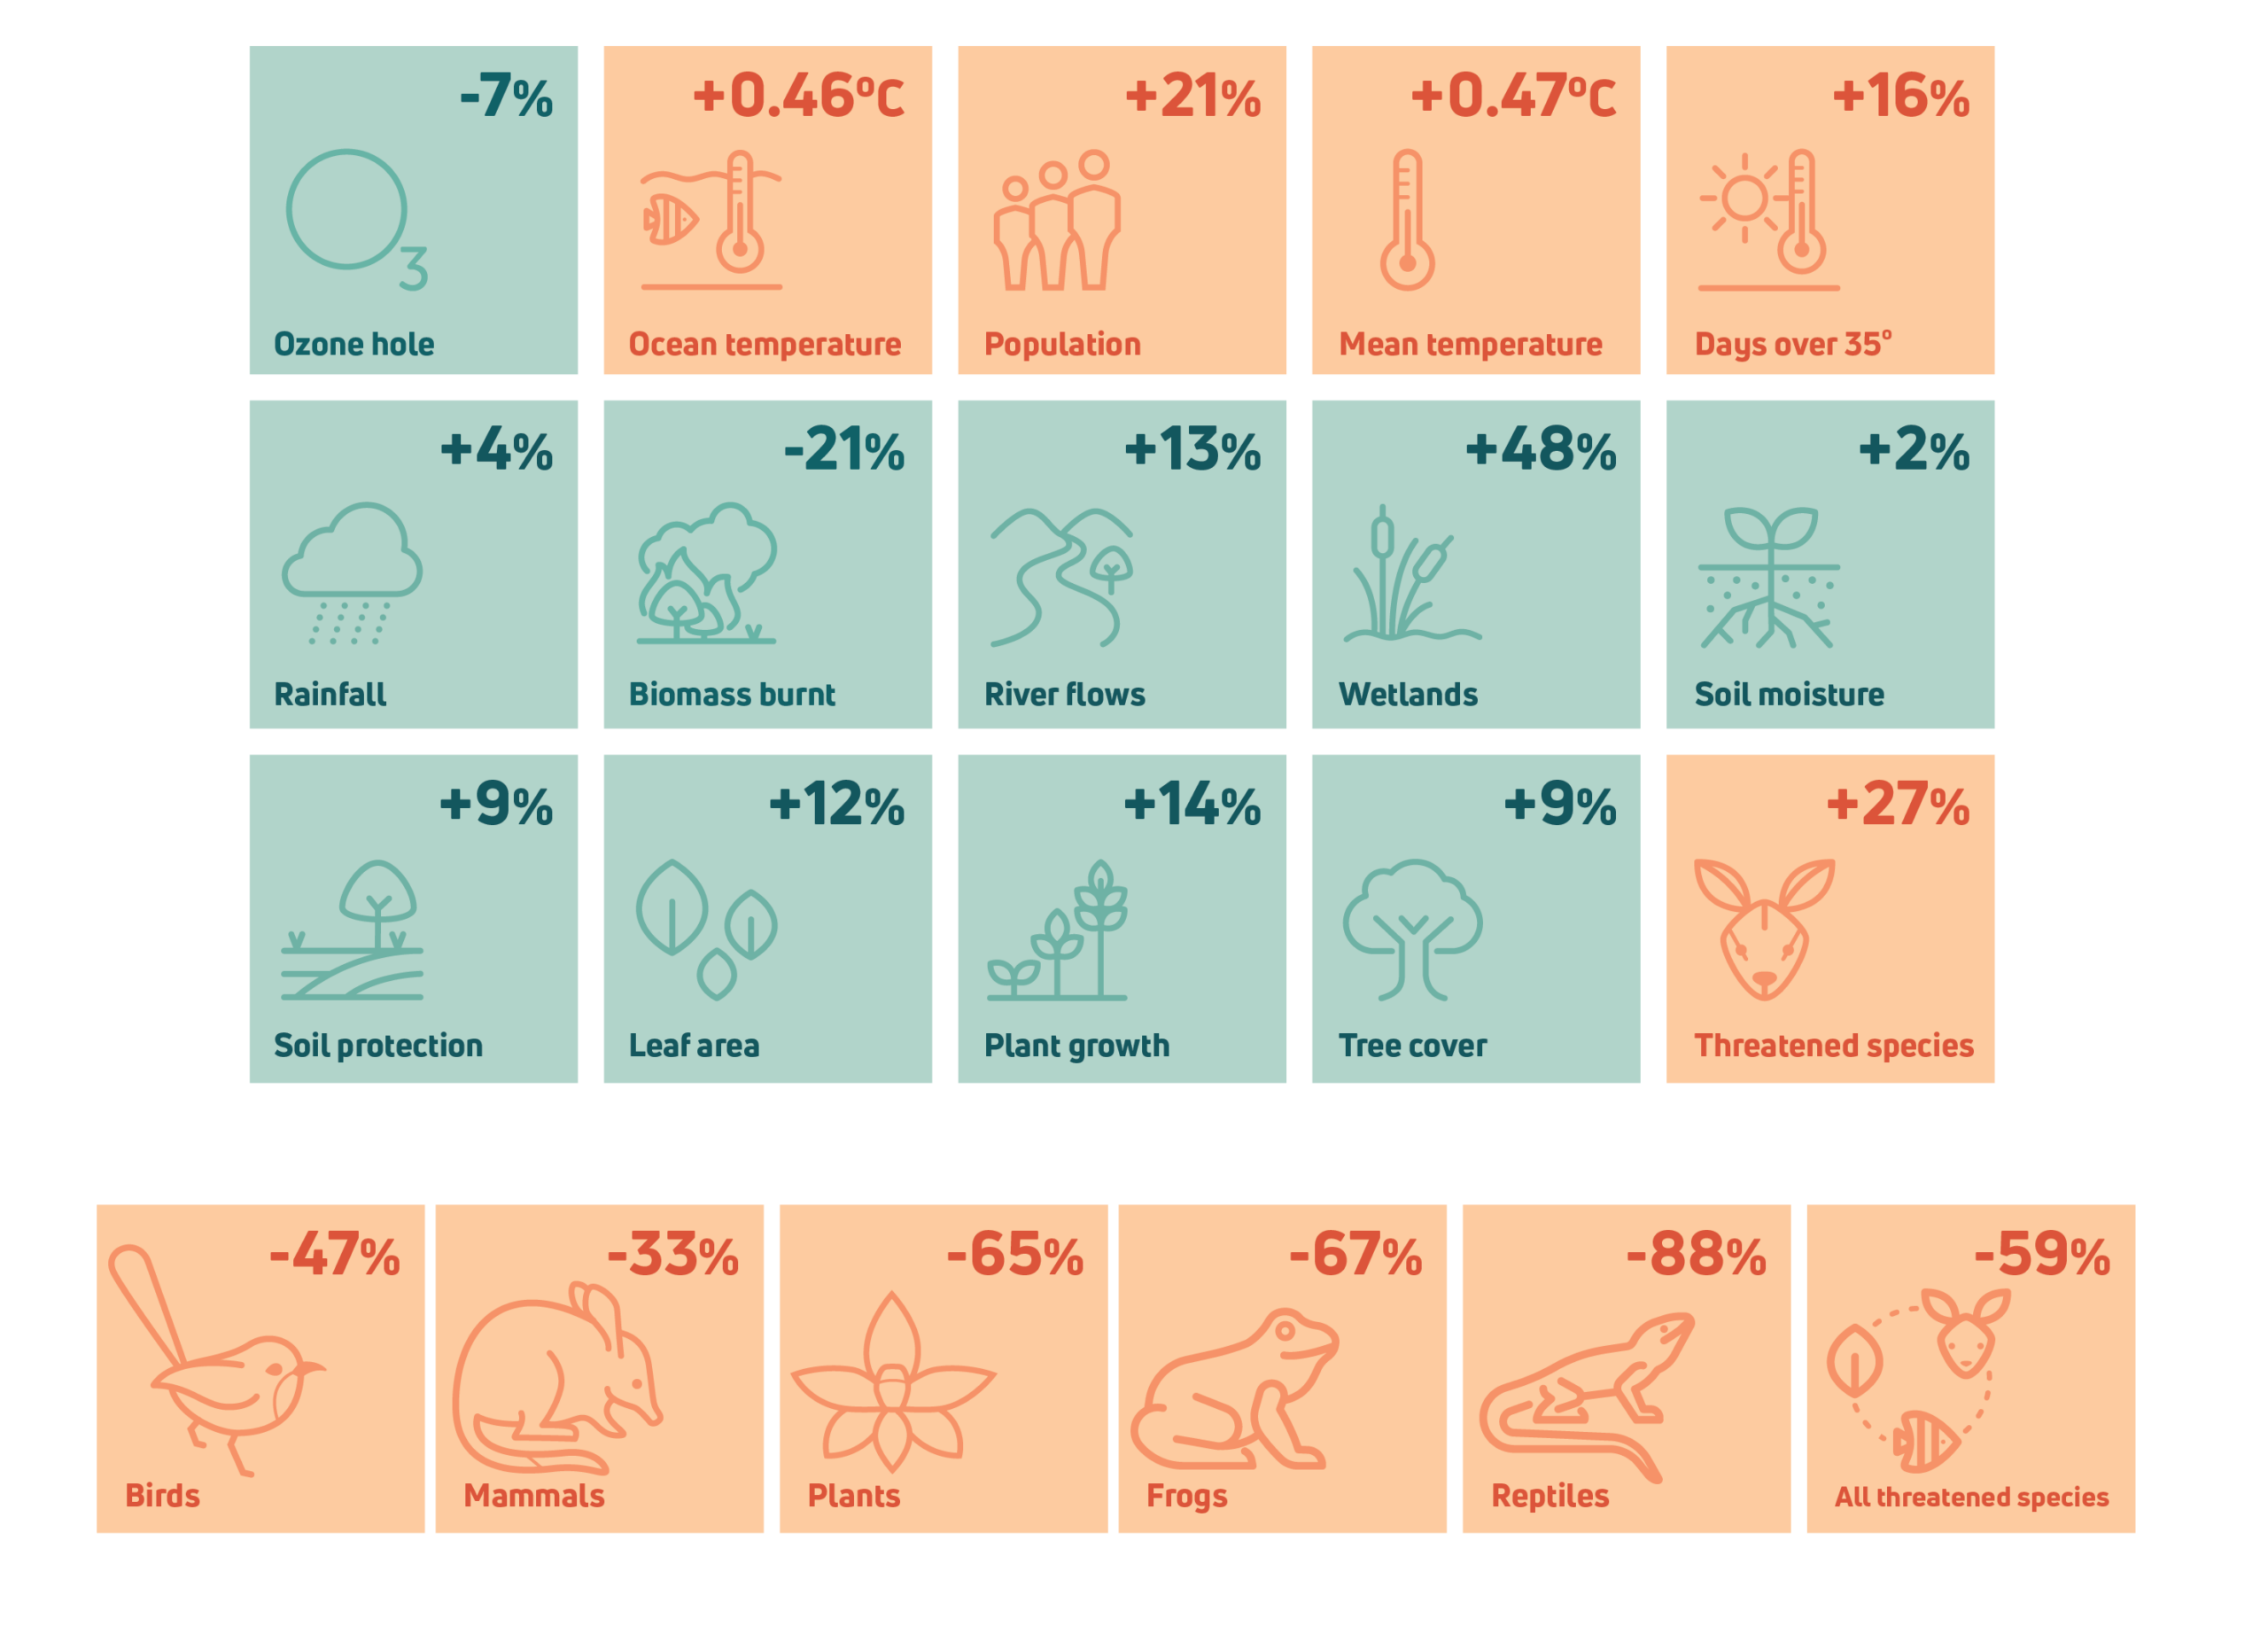
National Environment Indicators
Numbers represent the relative change from 2000–2024 average conditions. Such a change can be part of a long-term trend or be within normal variability. Details on each of the indicators shown are provided in this report.
Details on each of the indicators shown are provided in this report.
Where does this data come from?
Measures of the condition of natural resources and ecosystems were derived from several spatial data sources.
Weather data was derived by combining station satellite and weather forecast model data.
Data on land cover, inundation, fire, soil condition and vegetation leaf area were derived by automated interpretation of satellite imagery. Biodiversity analysis was based on the DCCEEW SPRAT database and Threatened Species Index (TSX), providing measures of change in the relative abundance of Australia's threatened and near-threatened species at national and regional levels.
The other indicators were estimated by combining the weather and satellite data in ANU's environmental data assimilation system, OzWALD.
For further details on data and methods or to download the data, read more.