
About the Data Explorer
- The Explorer provides direct access to environmental data summaries as maps, accounts and charts.
- Data can be examined by point location, region and landcover type, compared to preceding years, or downloaded for further analysis.
About
Spatial environmental data and time series can be challenging to work with. The Explorer aims to provide direct access to data summaries as maps, accounts and charts. Data can be examined by point location, region and landcover type, compared to preceding years, or downloaded for further analysis. The explorer currently offers data on weather, fire, water, soils and vegetation, as well as the Environmental Condition Score as an overall summary indicator. Lack of fully spatial national-scale observations means that information is not available for several important aspects of our environment, such as biodiversity.
Open the Data Explorer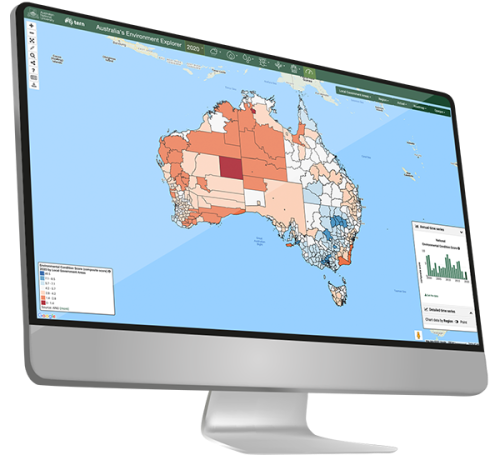
Where do the data come from?
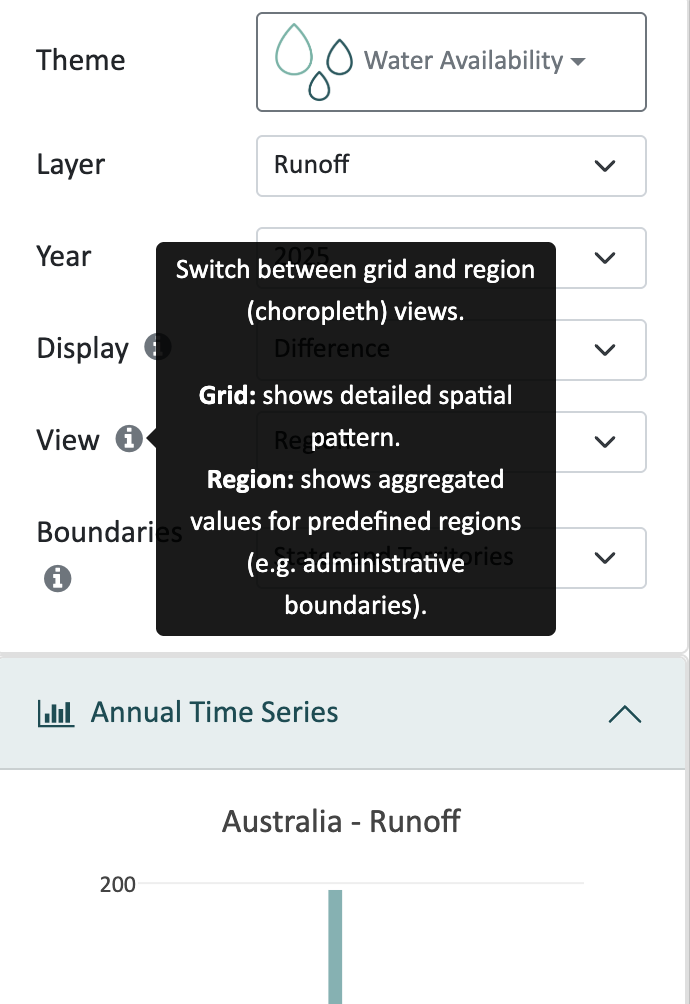
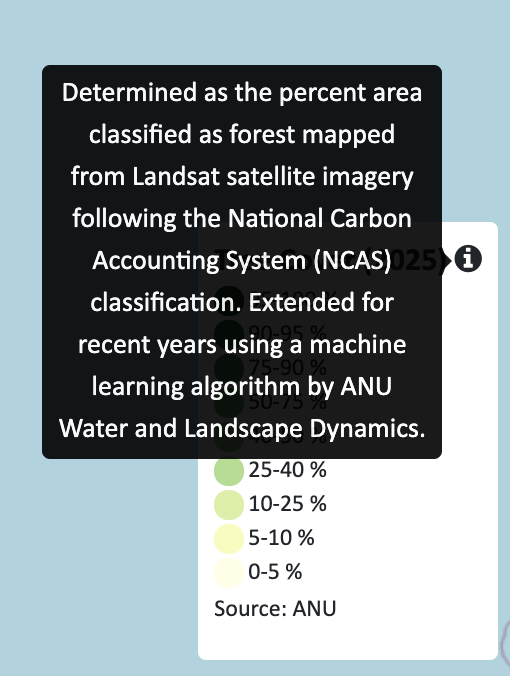
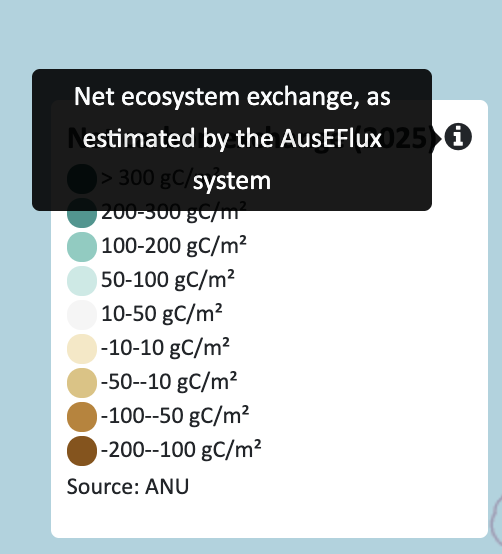
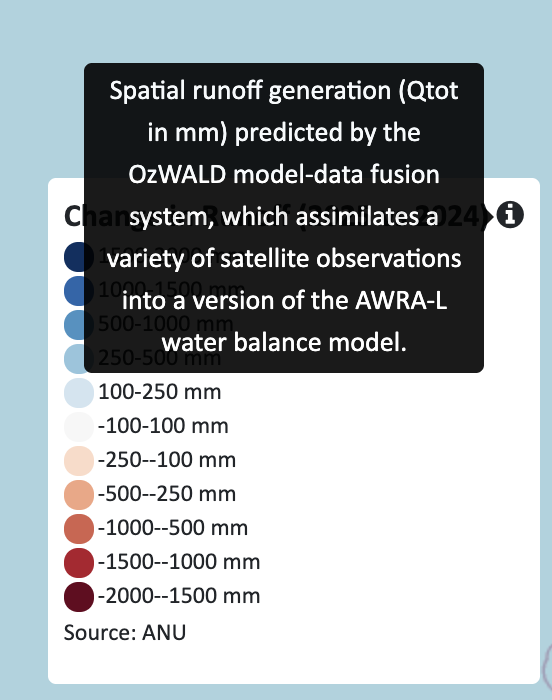
You can find a brief description of the origin of each data layer by clicking the information icon (i) next to the indicator title in the map legend or chart box, as shown in the examples above.
Further details on the meaning and origin of the data in the Data Explorer can be found in the following paper:
For details on the data, including their origin and how to download them, follow this link.