
 Fire
Fire
Key points
- Fire activity was above average nationally and fuel moisture conditions were drier than the previous year.
Fire activity
Bushfire seasons span two calendar years. The second half of the 2024–25 fire season saw significant activity in Tasmania from early February, where dry lightning started multiple fires in remote national parks and wilderness areas on 3 February. Driven by hot northerly winds and rainfall deficiencies that had persisted across the State since early 2023, the fires burned approximately 95,000 hectares of western and central Tasmania over two months, including areas of endemic vegetation in the Tasmanian Wilderness World Heritage Area.
In Victoria, a fire burned through 74,000 hectares of the Grampians National Park over 21 days in late January to early February, destroying four homes. The Grampians had largely recovered from previous fires and supported populations of several threatened species including the southern brush-tailed rock-wallaby, making the ecological impact of this fire significant beyond immediate property losses.
The early 2025–26 season brought an unusually early and severe start, consistent with forecasts of heightened risk for parts of WA, NSW and Victoria. On 6 December, over 50 fires burned across NSW simultaneously. A fire at Koolewong on the Central Coast destroyed 16 homes. In Tasmania, fires at Dolphin Sands destroyed 19 homes on the State’s east coast. Two firefighters died during the season — a South Australian CFS volunteer in November and a NSW National Parks officer in December.
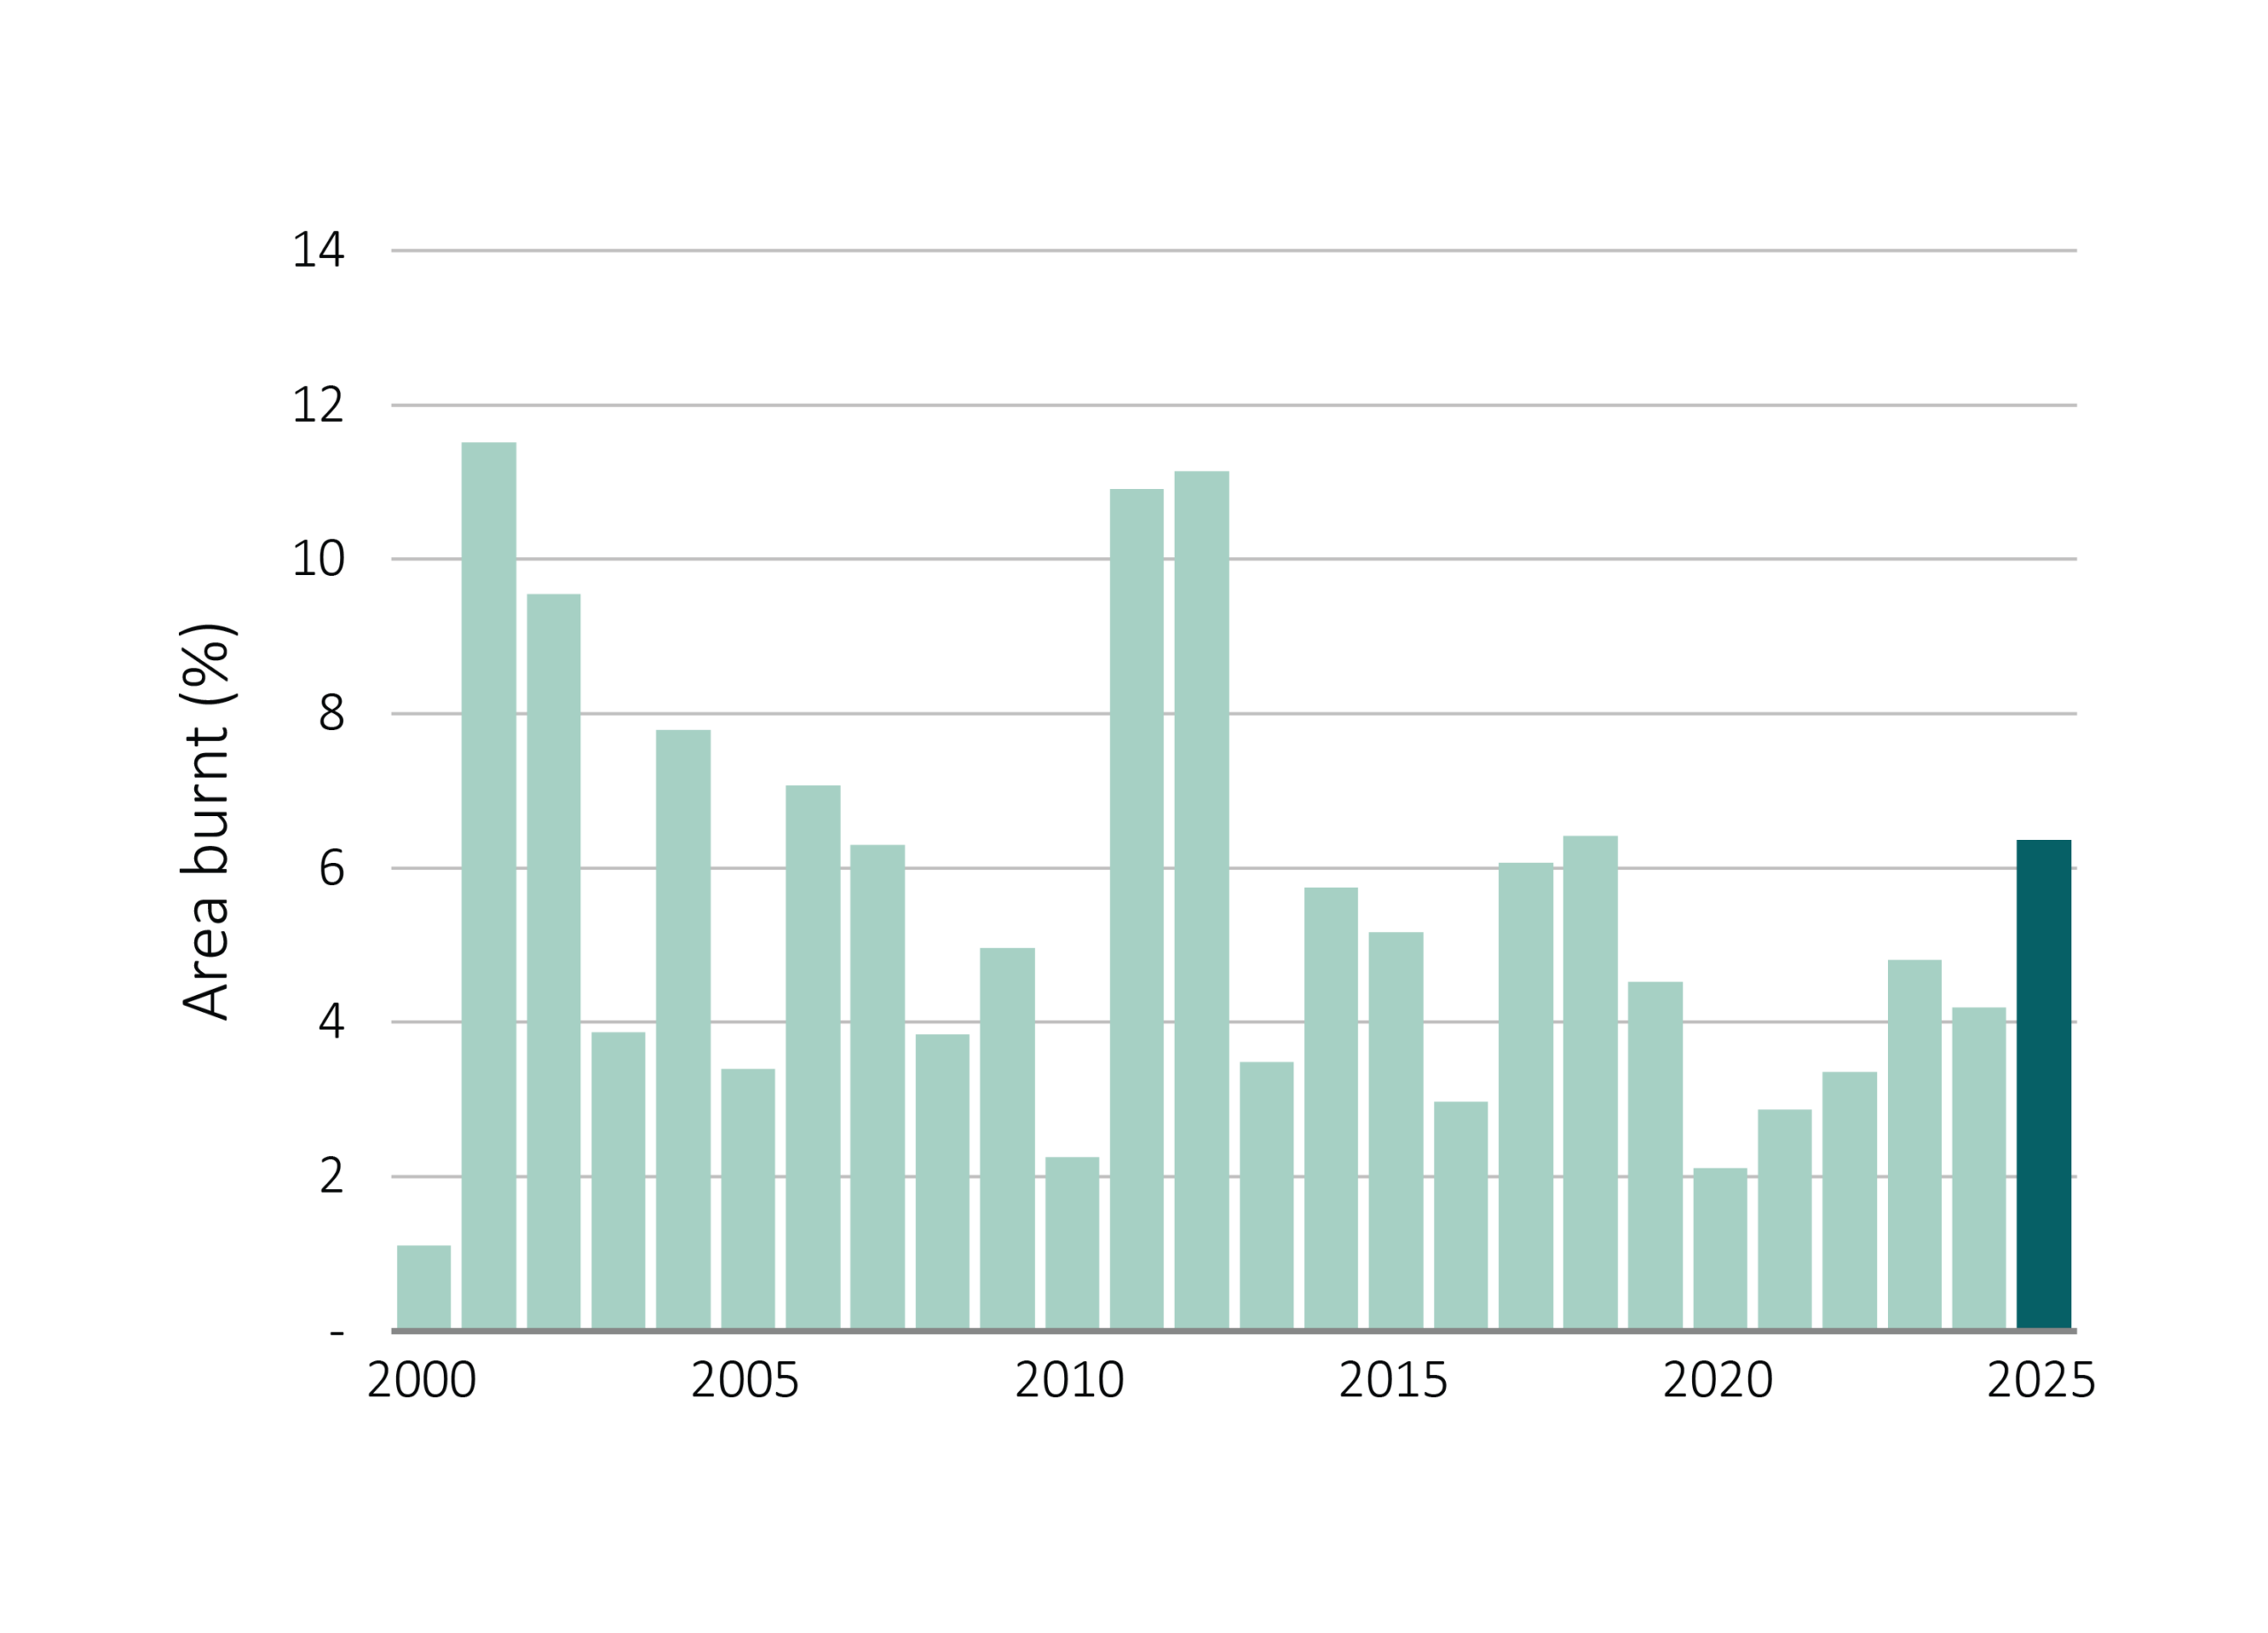
The total area burnt in 2025 was 50 Mha, 46% above the previous year and 14% above the 2000–2024 average. Fire activity was well above average in Tasmania and just above average in Queensland and the Northern Territory, while it was below average in NSW and South Australia.
The minimum live fuel moisture content recorded during 2025 was 4% lower than in 2024 and 2% below the 2000–2024 average, the fifth-lowest value since 2000, indicating somewhat drier landscape conditions than recent years over inland and southern Australia though not at historic extremes.
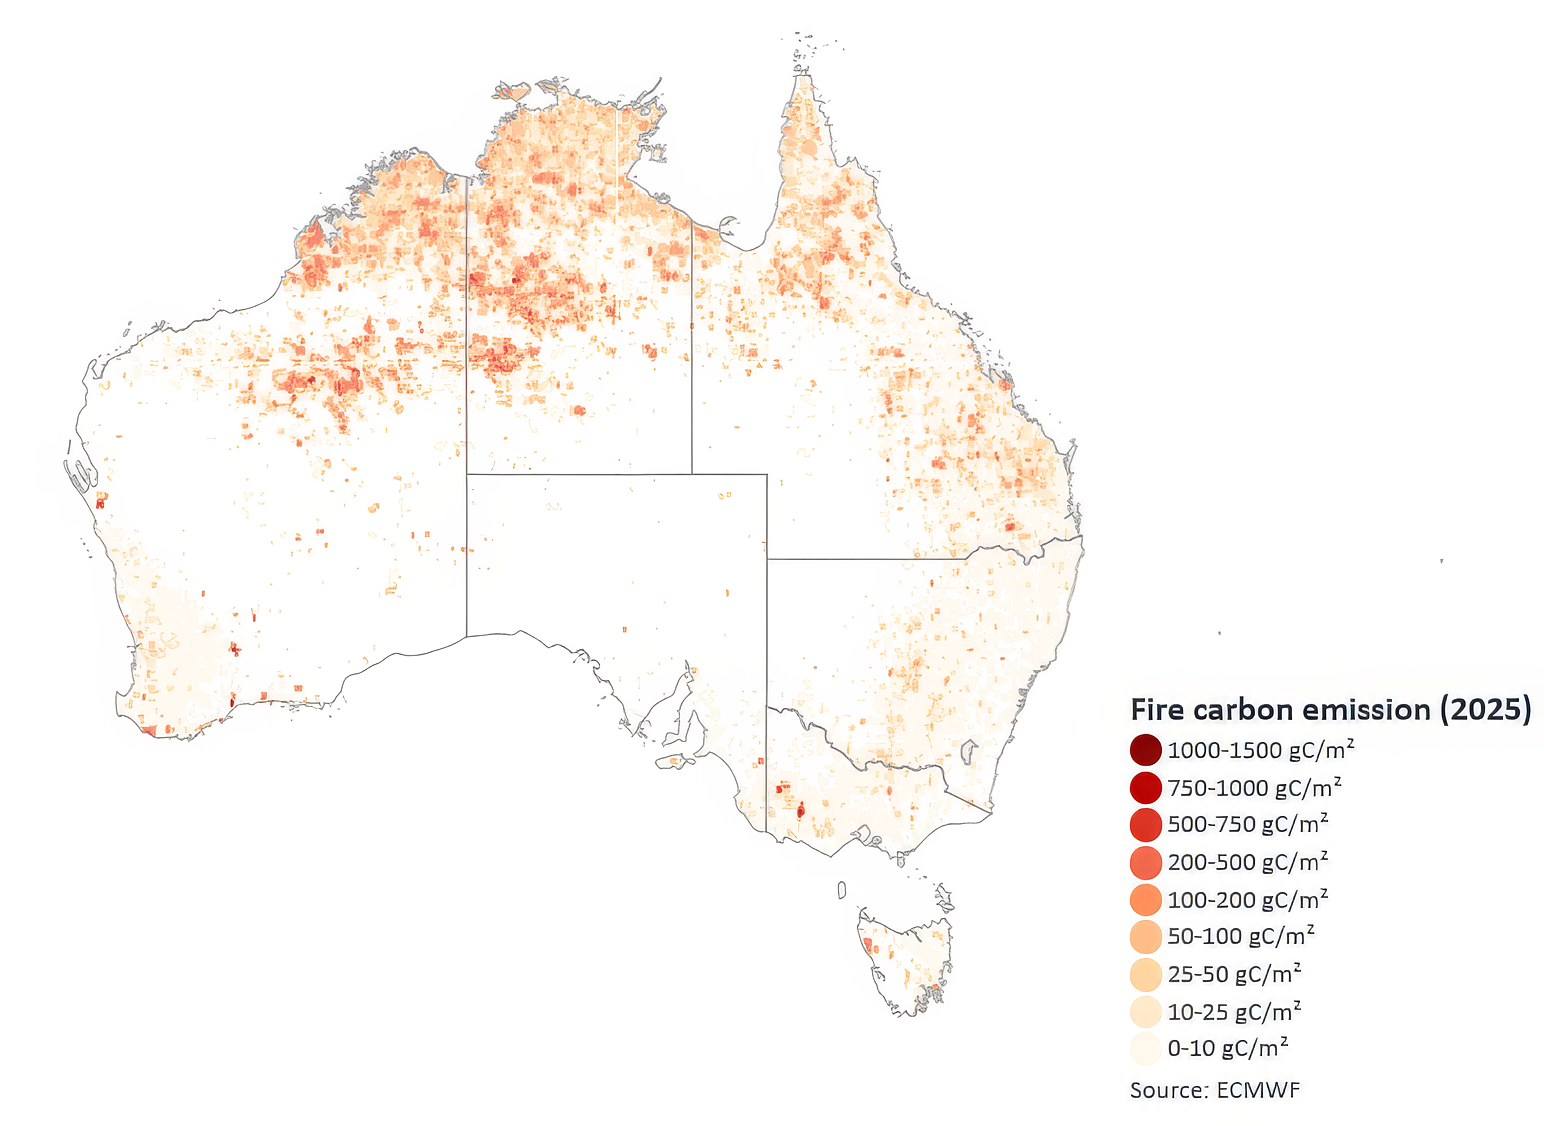
Total fire carbon emissions were approximately 117 Mt carbon, 12% higher than 2024 but 21% below the 2000–2024 average. As in most years, savanna fires in northern Australia accounted for the majority of fire emissions
Where does this data come from?
Measures of the condition of natural resources and ecosystems were derived from several spatial data sources.
Weather data was derived by combining station satellite and weather forecast model data.
Data on land cover, inundation, fire, soil condition and vegetation leaf area were derived by automated interpretation of satellite imagery. Biodiversity analysis was based on the DCCEEW SPRAT database and Threatened Species Index (TSX), providing measures of change in the relative abundance of Australia's threatened and near-threatened species at national and regional levels.
The other indicators were estimated by combining the weather and satellite data in ANU's environmental data assimilation system, OzWALD.
For further details on data and methods or to download the data, read more.