
 Oceans
Key points
- The 2024–25 summer was the most severe on record for coral reef heat stress around Australia, and marine heatwaves caused major ecological impacts on all sides of the continent.
Coral reef heat & sea level
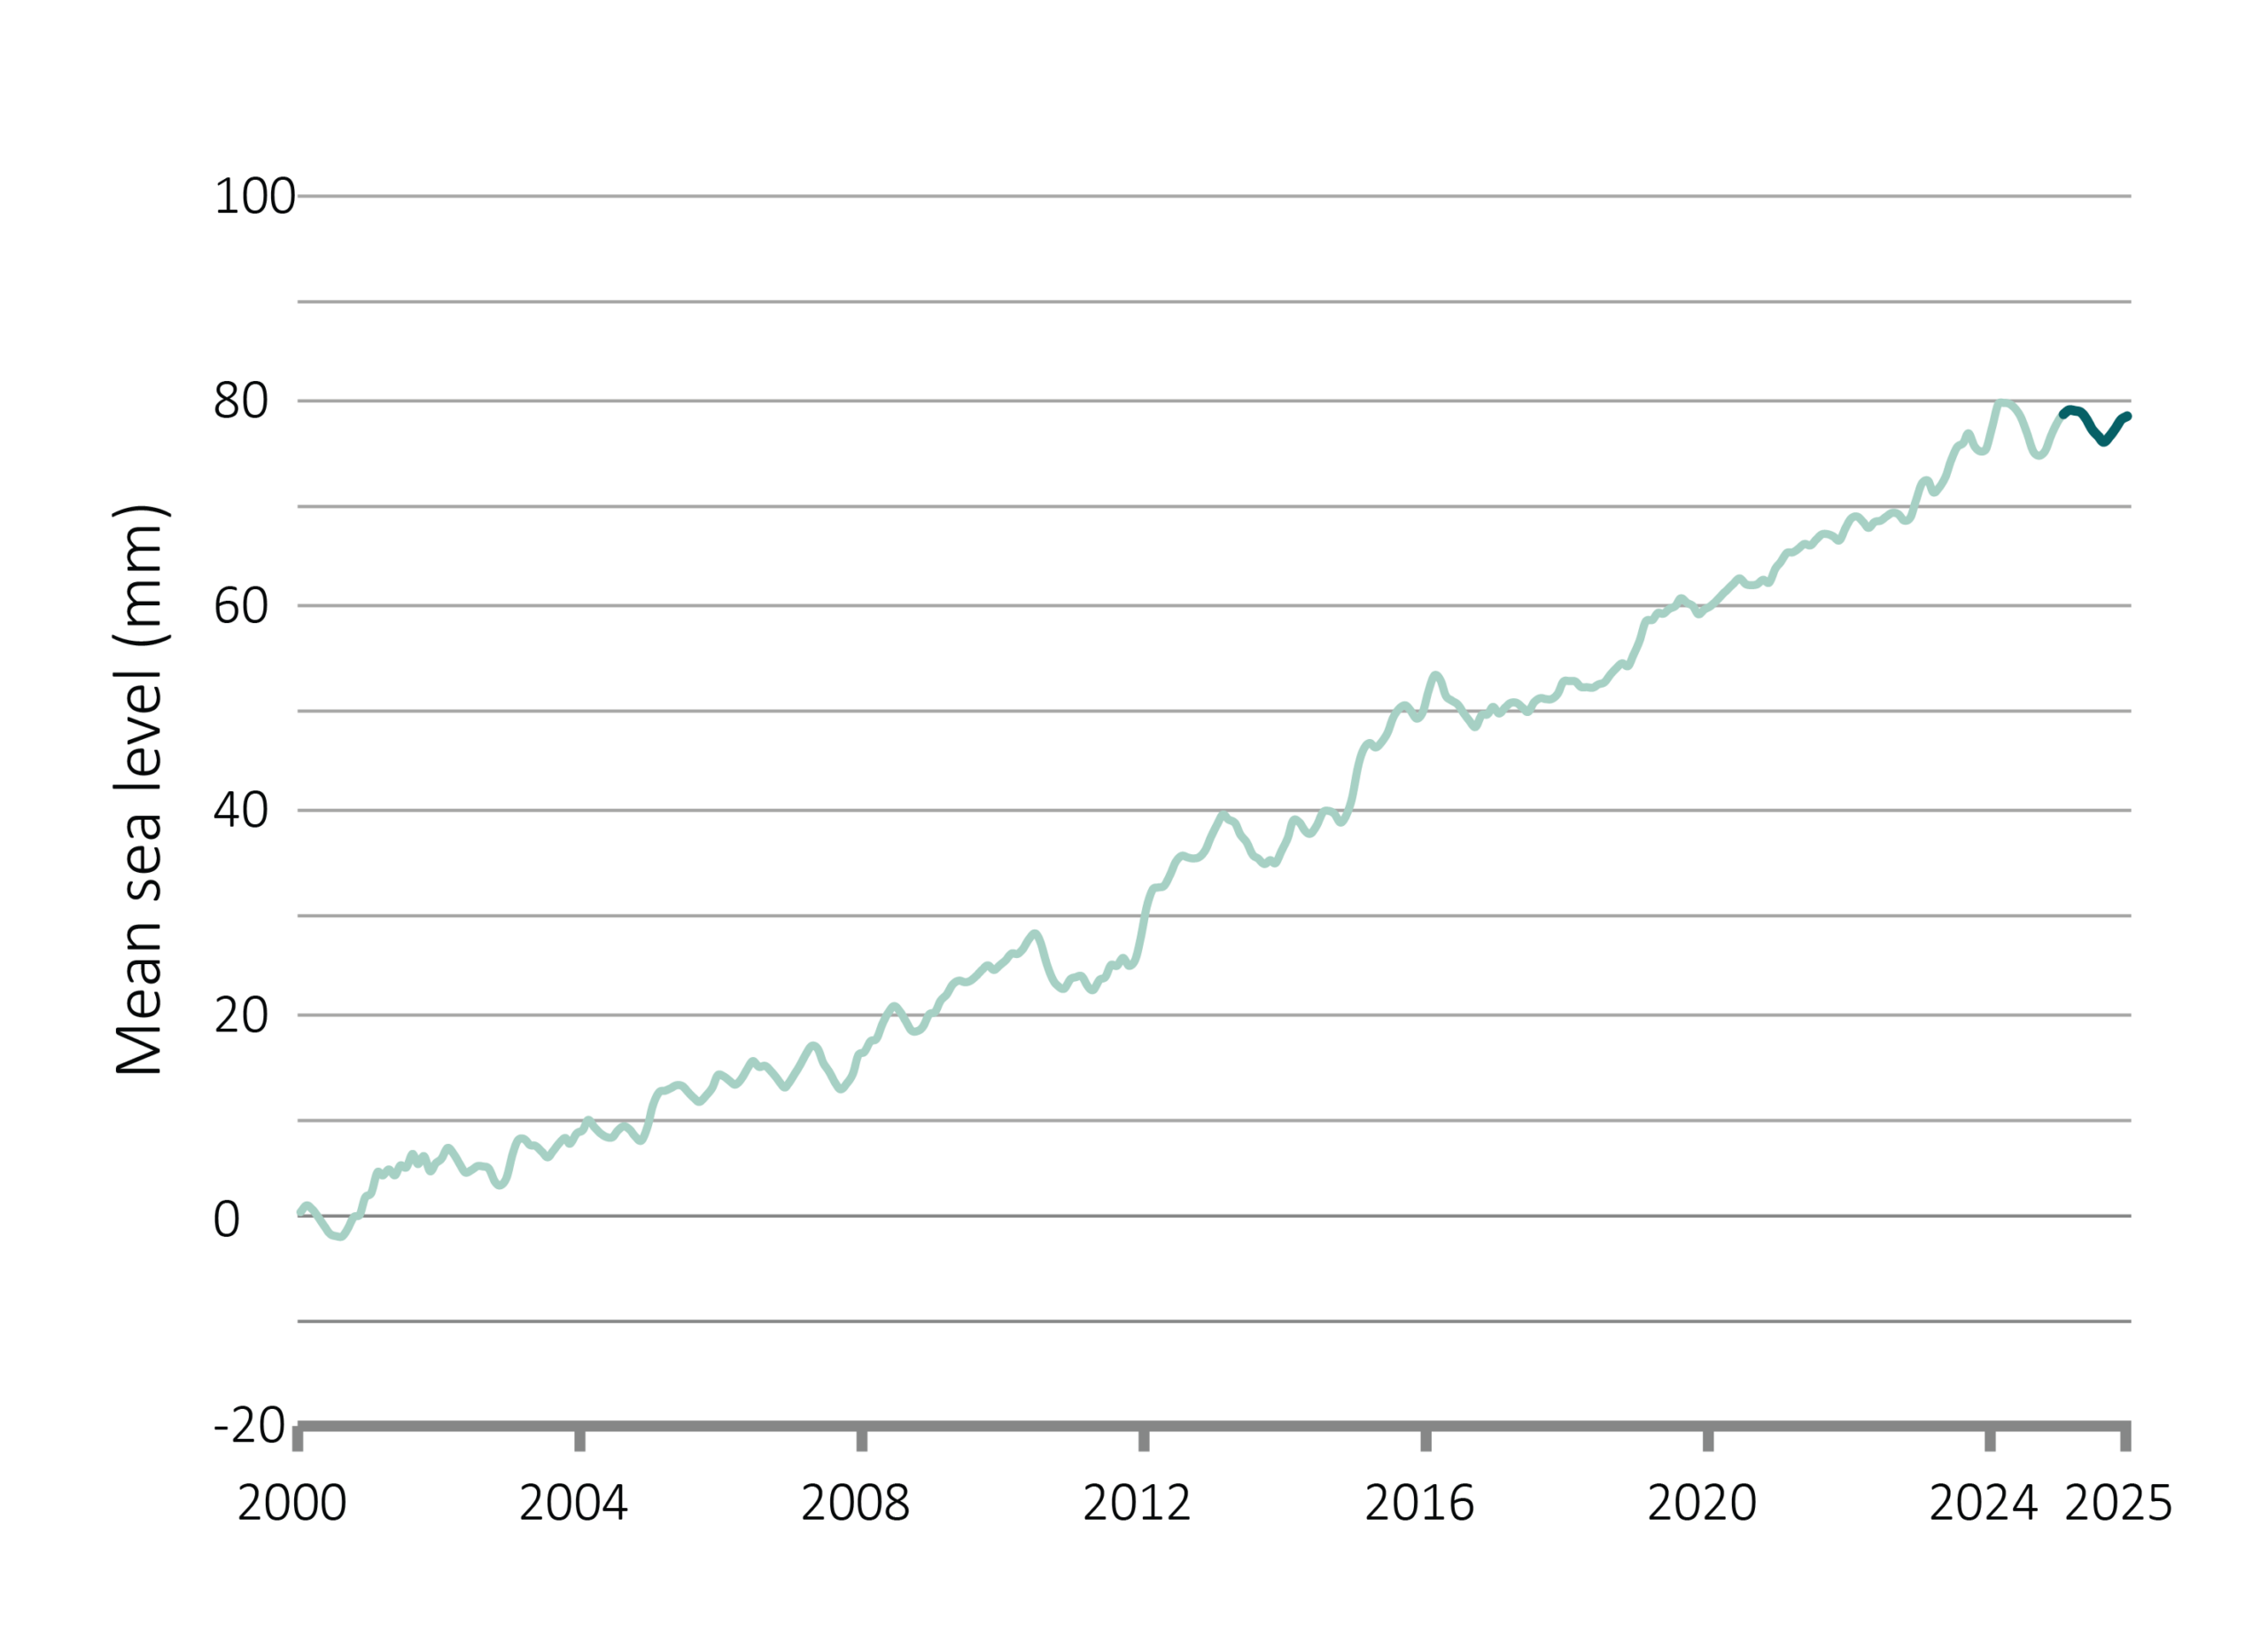
Oceans absorb 93% of the excess heat generated by climate change. Global ocean heat content increased at one of the fastest rates on record in 2025, continuing a steady rise, with ocean temperatures increasing for the sixth consecutive year and in 20 of the last 25 years. The stored heat drives sea level rise, fuels marine heatwaves and intensifies coral bleaching.
Global mean sea level rose by 0.35 mm in 2025, the slowest annual rise since 2017. This largely reflects a temporary effect of La Niña conditions driving increased rainfall over the Amazon basin and shifting water from ocean to land. The long-term increasing sea level trend remains strong, with a rise of 78 mm since 2000 and 98 mm since 1993. Global mean sea surface temperatures were the third highest on record, with the last three years the warmest three on record.
Sea surface temperatures in the Australian region reached their highest recorded level in 2025, exceeding even the previous record set in 2024. The resulting marine heatwaves triggered fish kills, harmful algal blooms — including a large-scale Karenia bloom off South Australia that killed millions of animals including weedy seadragons, dolphins and sea lions. High temperatures also contributed to the appearance of tropical species such as Cobia (black kingfish) far outside their normal range.
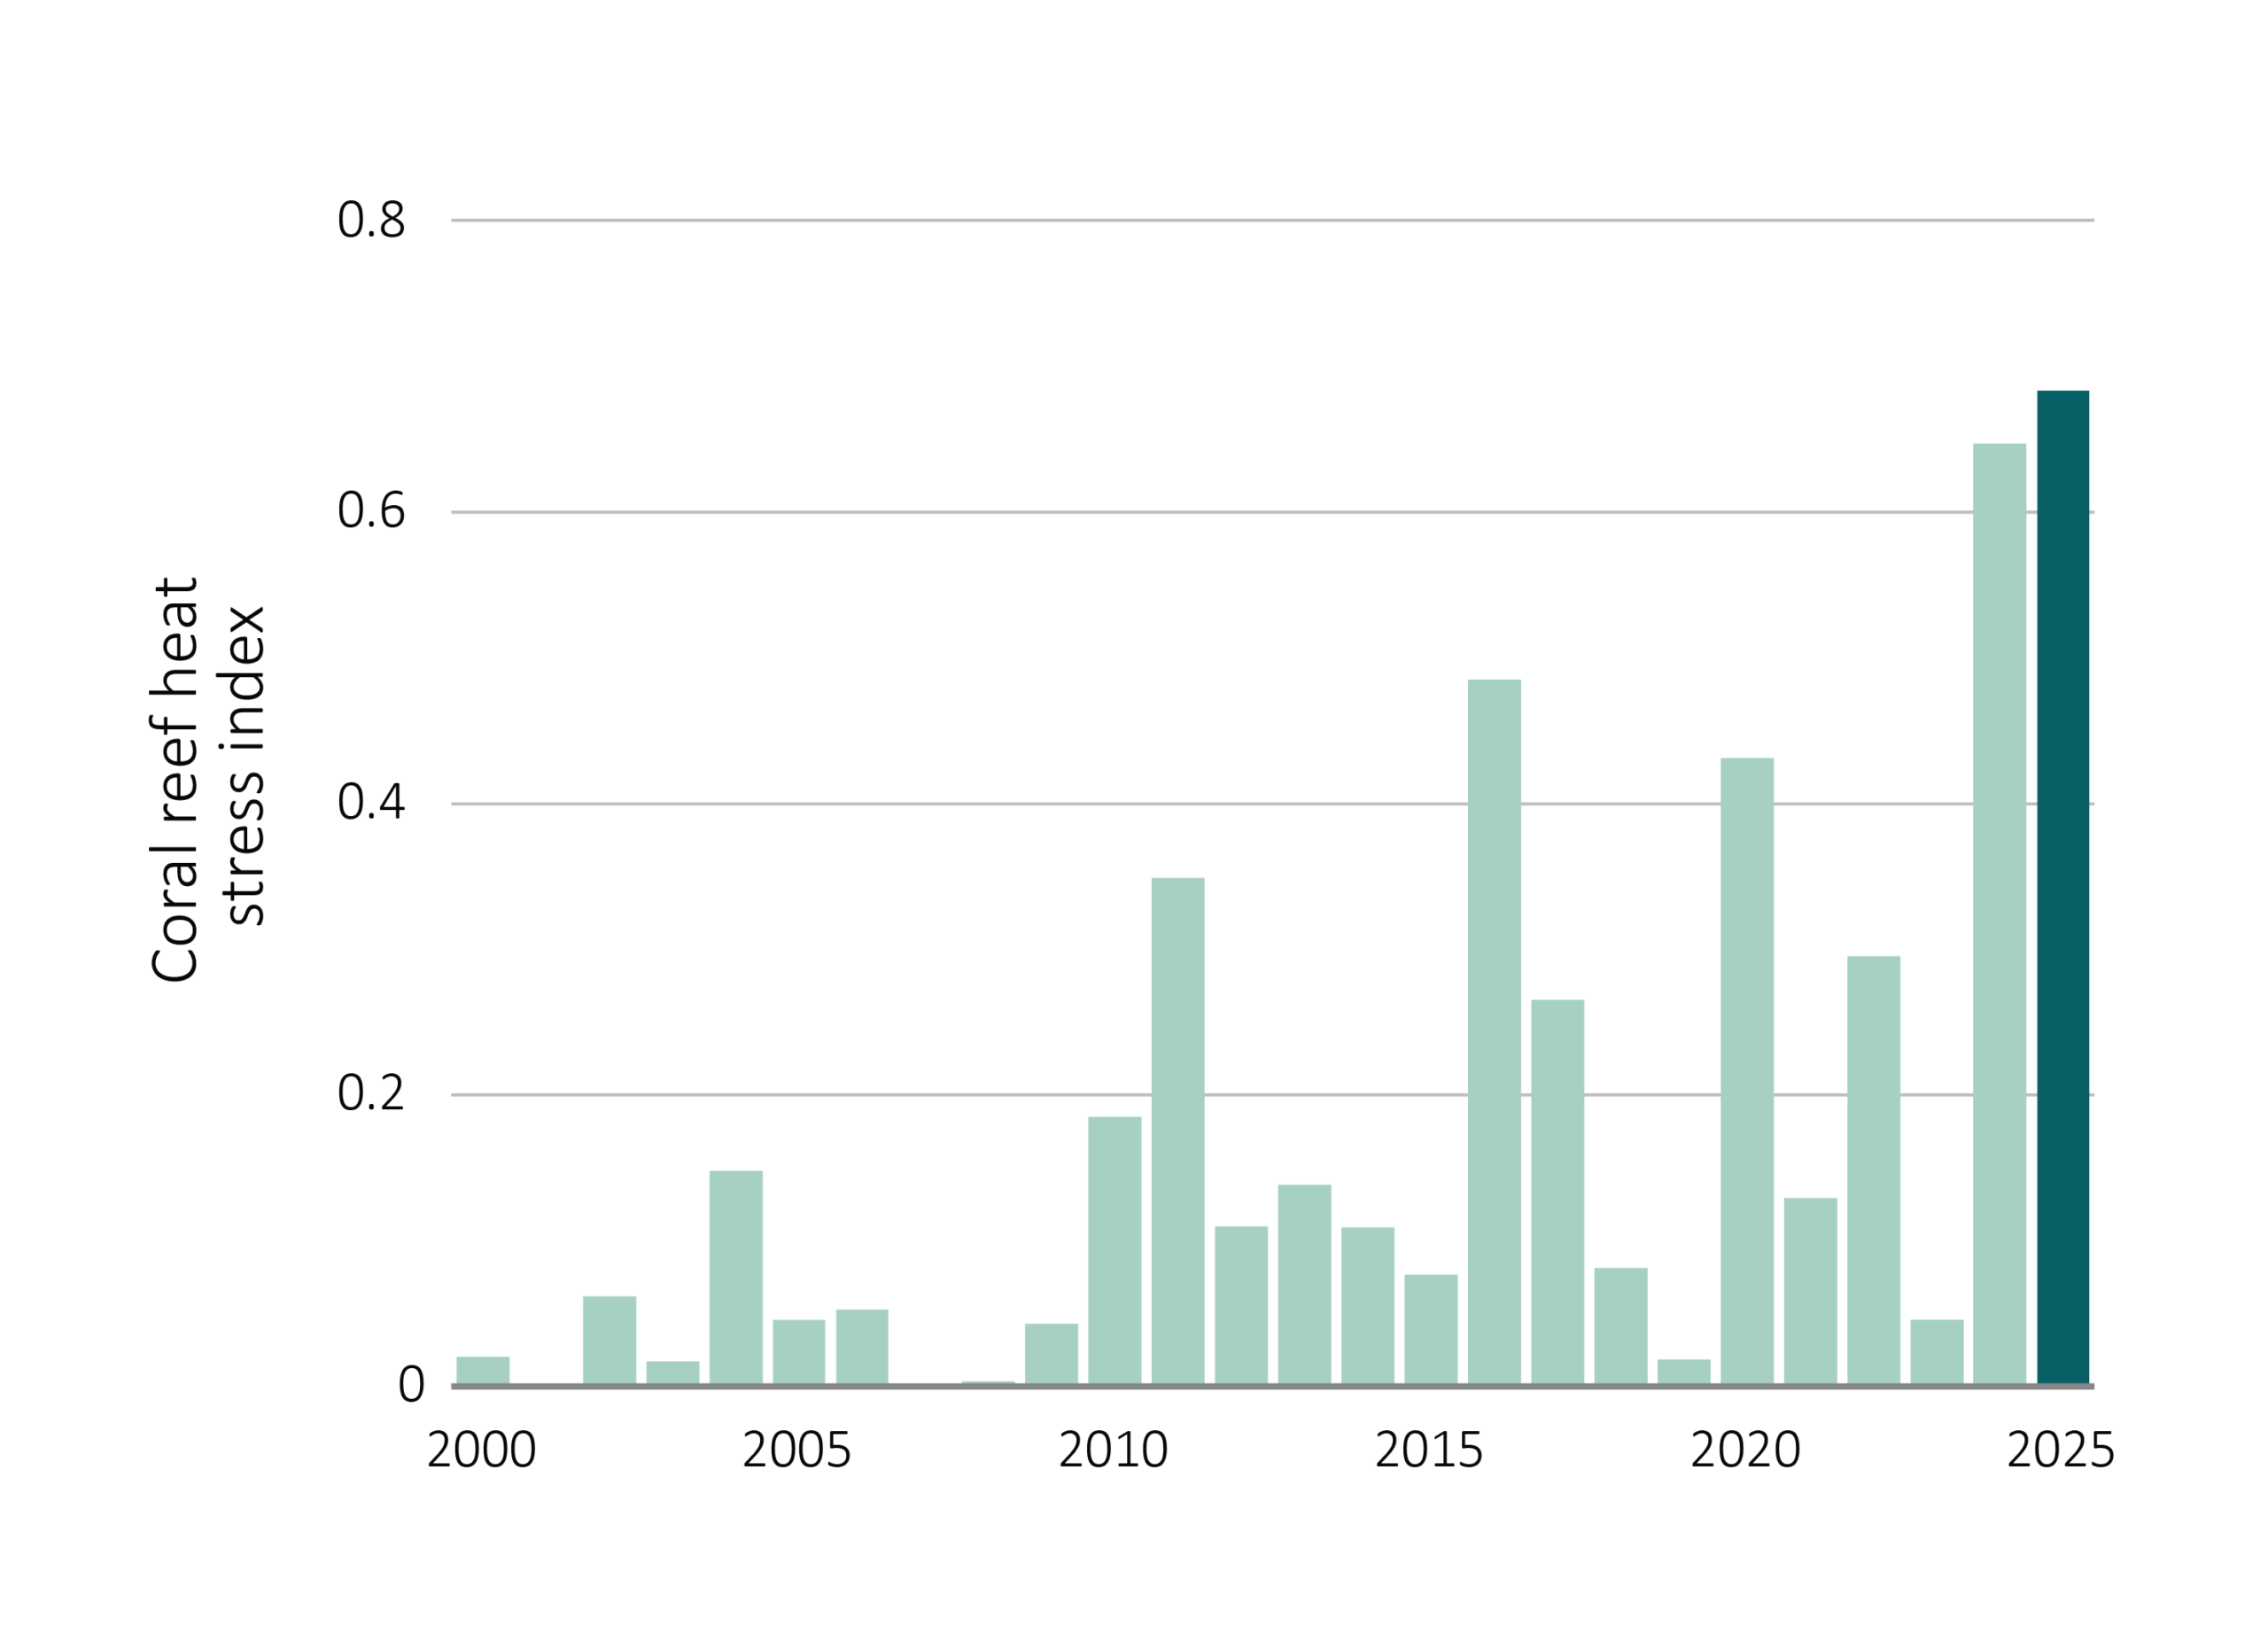
Satellite-monitored reef locations around Australia showed that 79% of stations exceeded their 1-in-10-year heat stress threshold in 2024–25, more than any previous year in the 40-year record. The 2024 mass bleaching event — the fifth on the Great Barrier reef since 2016 and the largest ever recorded in spatial extent — reduced hard coral cover by 14–30% across the reef, with some areas losing over 70%. The northern and southern regions each recorded their largest single-year decline in 39 years of monitoring. A sixth mass bleaching event followed in early 2025, affecting the Karenia cristata and reefs across north-western Australia including Ningaloo, the inshore Kimberley and the Rowley Shoals. Since 2016, bleaching seasons have become both more frequent and more severe, a pattern that accelerated sharply in 2024–25. Compounding these pressures, crown-of-thorns starfish outbreaks — which prey on corals already weakened by bleaching — were detected on 22% of surveyed reefs, with established outbreaks in both the northern and southern GBR.
Where does this data come from?
Measures of the condition of natural resources and ecosystems were derived from several spatial data sources.
Weather data was derived by combining station satellite and weather forecast model data.
Data on land cover, inundation, fire, soil condition and vegetation leaf area were derived by automated interpretation of satellite imagery. Biodiversity analysis was based on the DCCEEW SPRAT database and Threatened Species Index (TSX), providing measures of change in the relative abundance of Australia's threatened and near-threatened species at national and regional levels.
The other indicators were estimated by combining the weather and satellite data in ANU's environmental data assimilation system, OzWALD.
For further details on data and methods or to download the data, read more.