
 People
Key points
- Australia’s population and economy both grew in 2025 while greenhouse gas emissions fell, showing progress in decoupling economic activity from environmental impact. However, population growth continues to drive rising demand for land and resources, with impacts on the environment.
Population
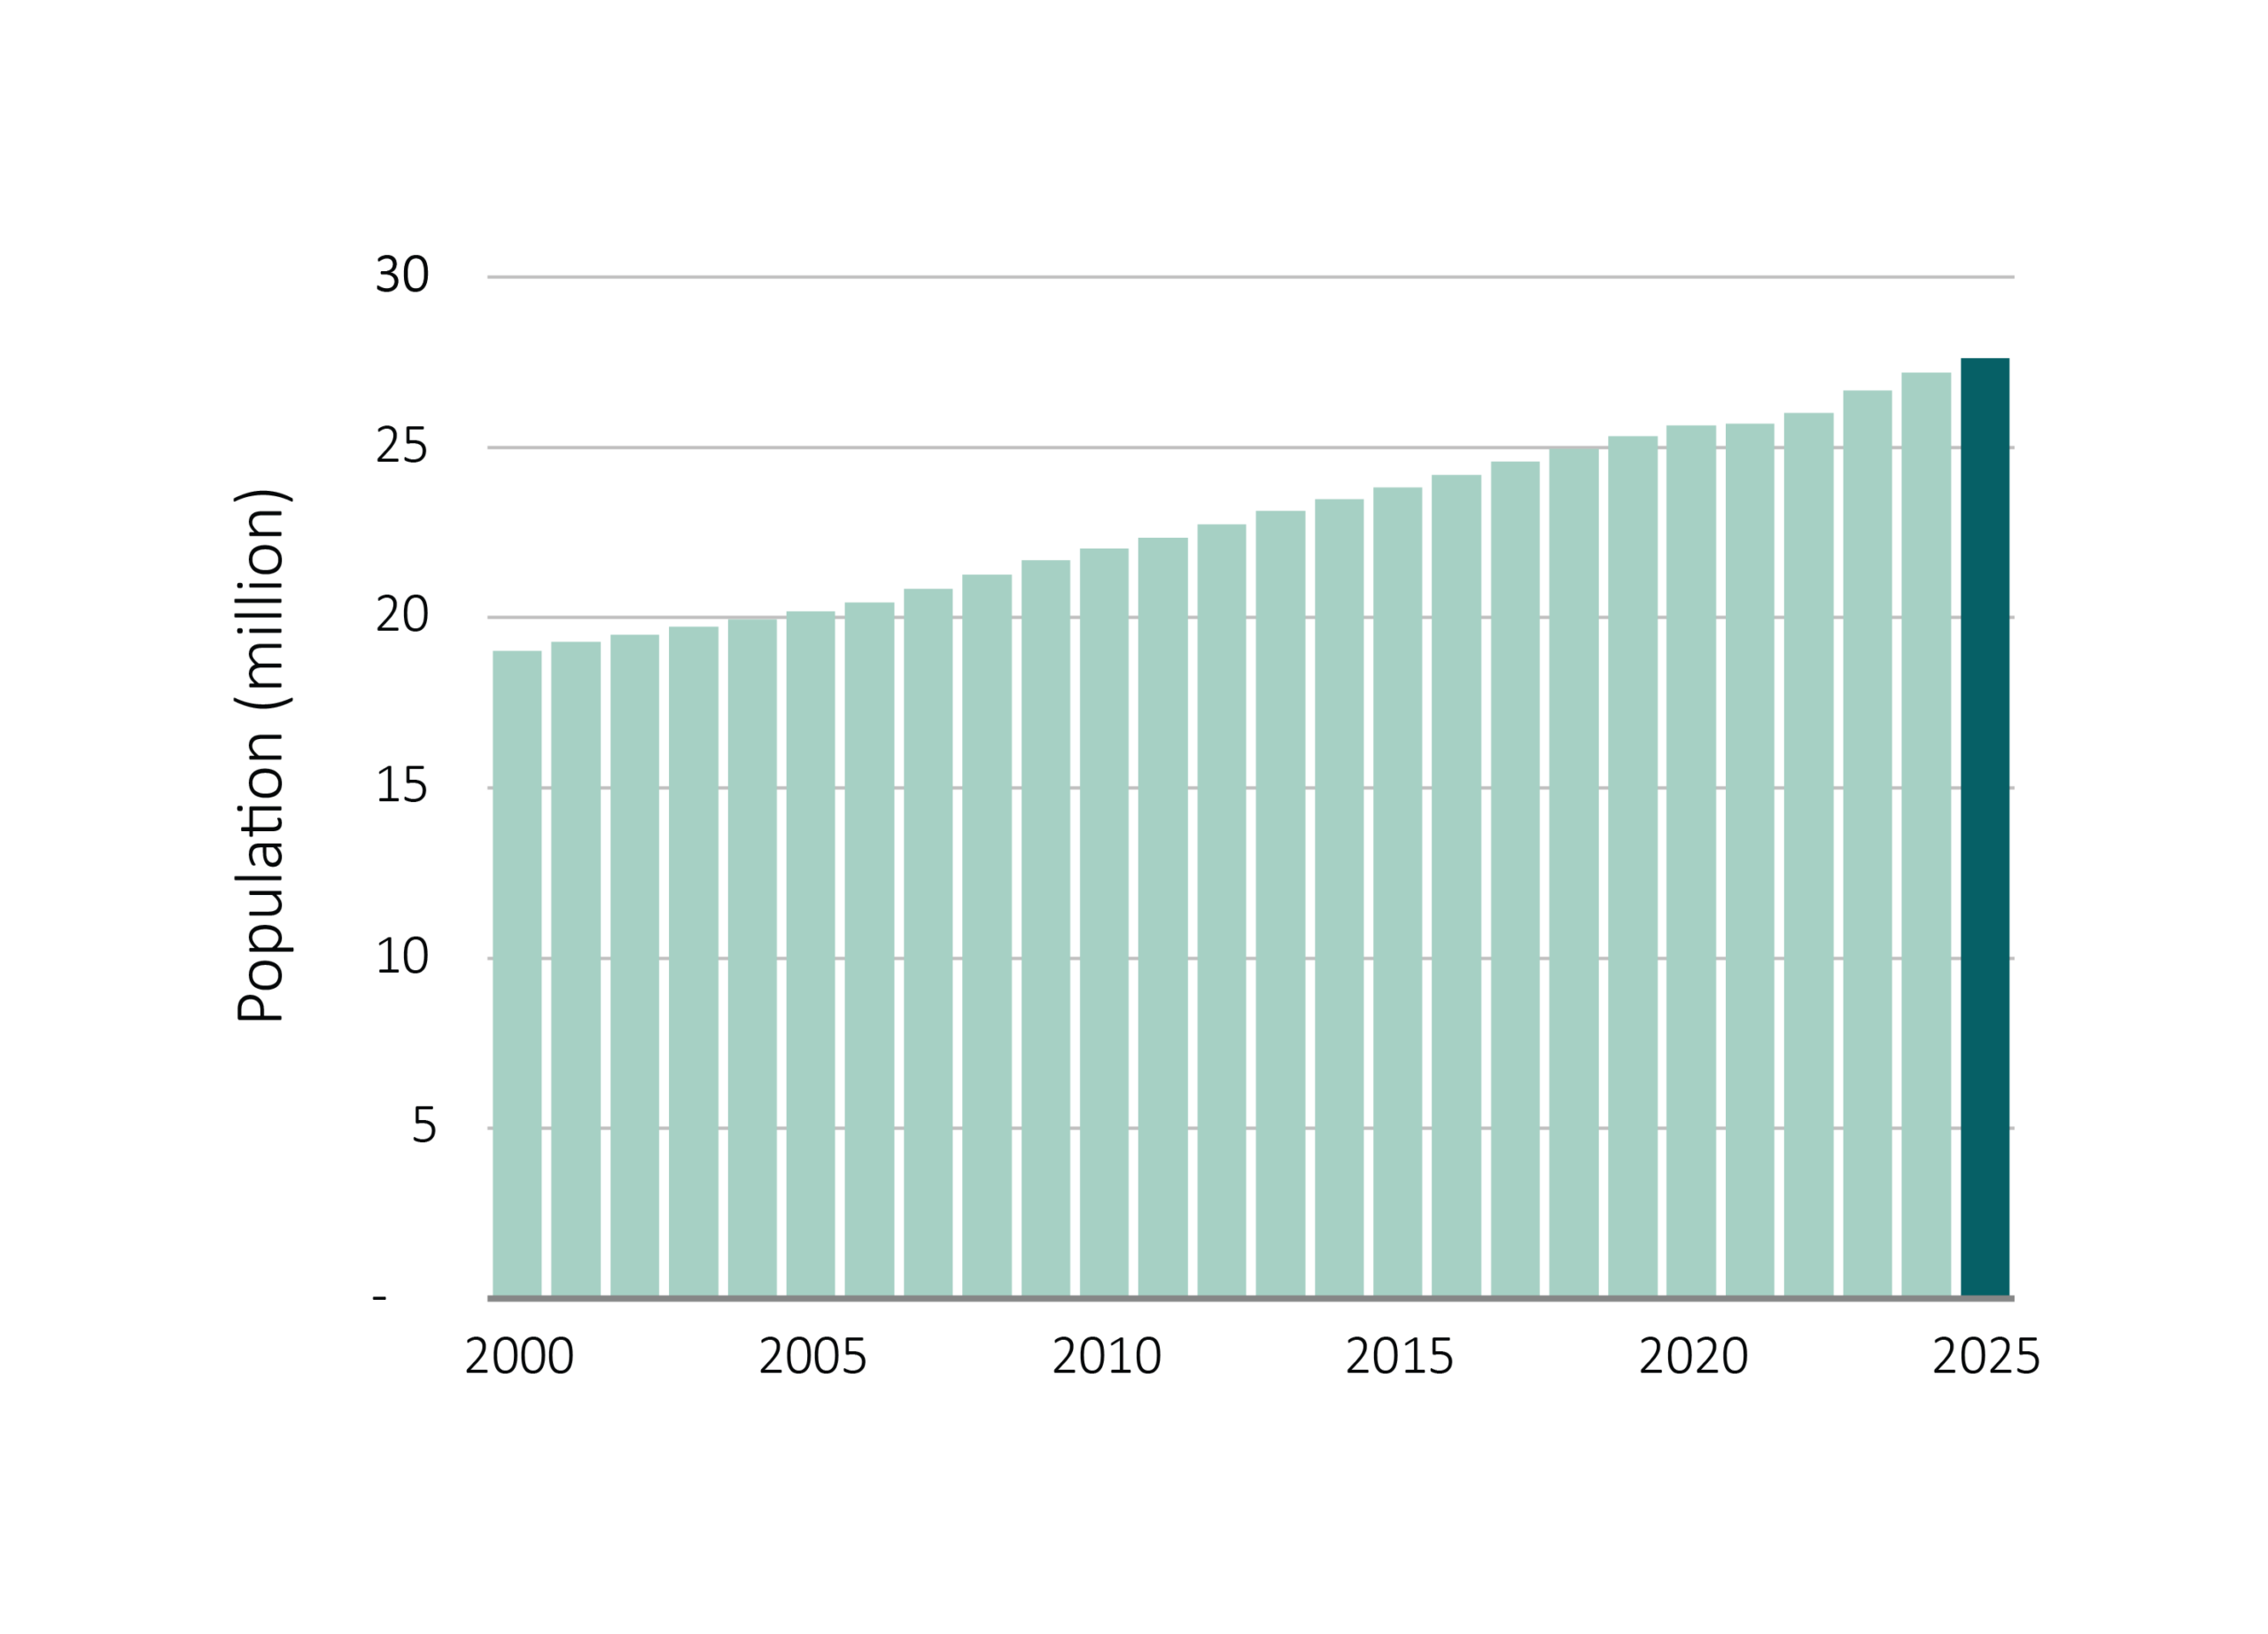
Australia’s population grew by 1.5%, or more than 400,000 people, to reach 27.6 million in 2025. Growth was less than the two years before but 25% higher than the 2000–2024 average population growth rate. Most of the increase occurred in and around the major cities, while population declined in most rural areas. Urban expansion places direct pressure on surrounding native vegetation, waterways and coastal ecosystems through land clearing, increased runoff and greater demand for water supply infrastructure.
Building approvals — a ready, if imperfect, measure of land and resource use for construction — were the highest since 2021 and 7% higher than the 2000–2024 average, reflecting continued pressure on land and the materials and energy needed for construction.
Australia’s economy grew by 2.6% in 2025. Despite this, greenhouse gas emissions decreased by 1.9%, implying that the carbon intensity of the economy, measured in emissions per dollar of output, fell by around 4.4%. This continues a long-term but slow trend of decoupling economic activity from environmental impact.
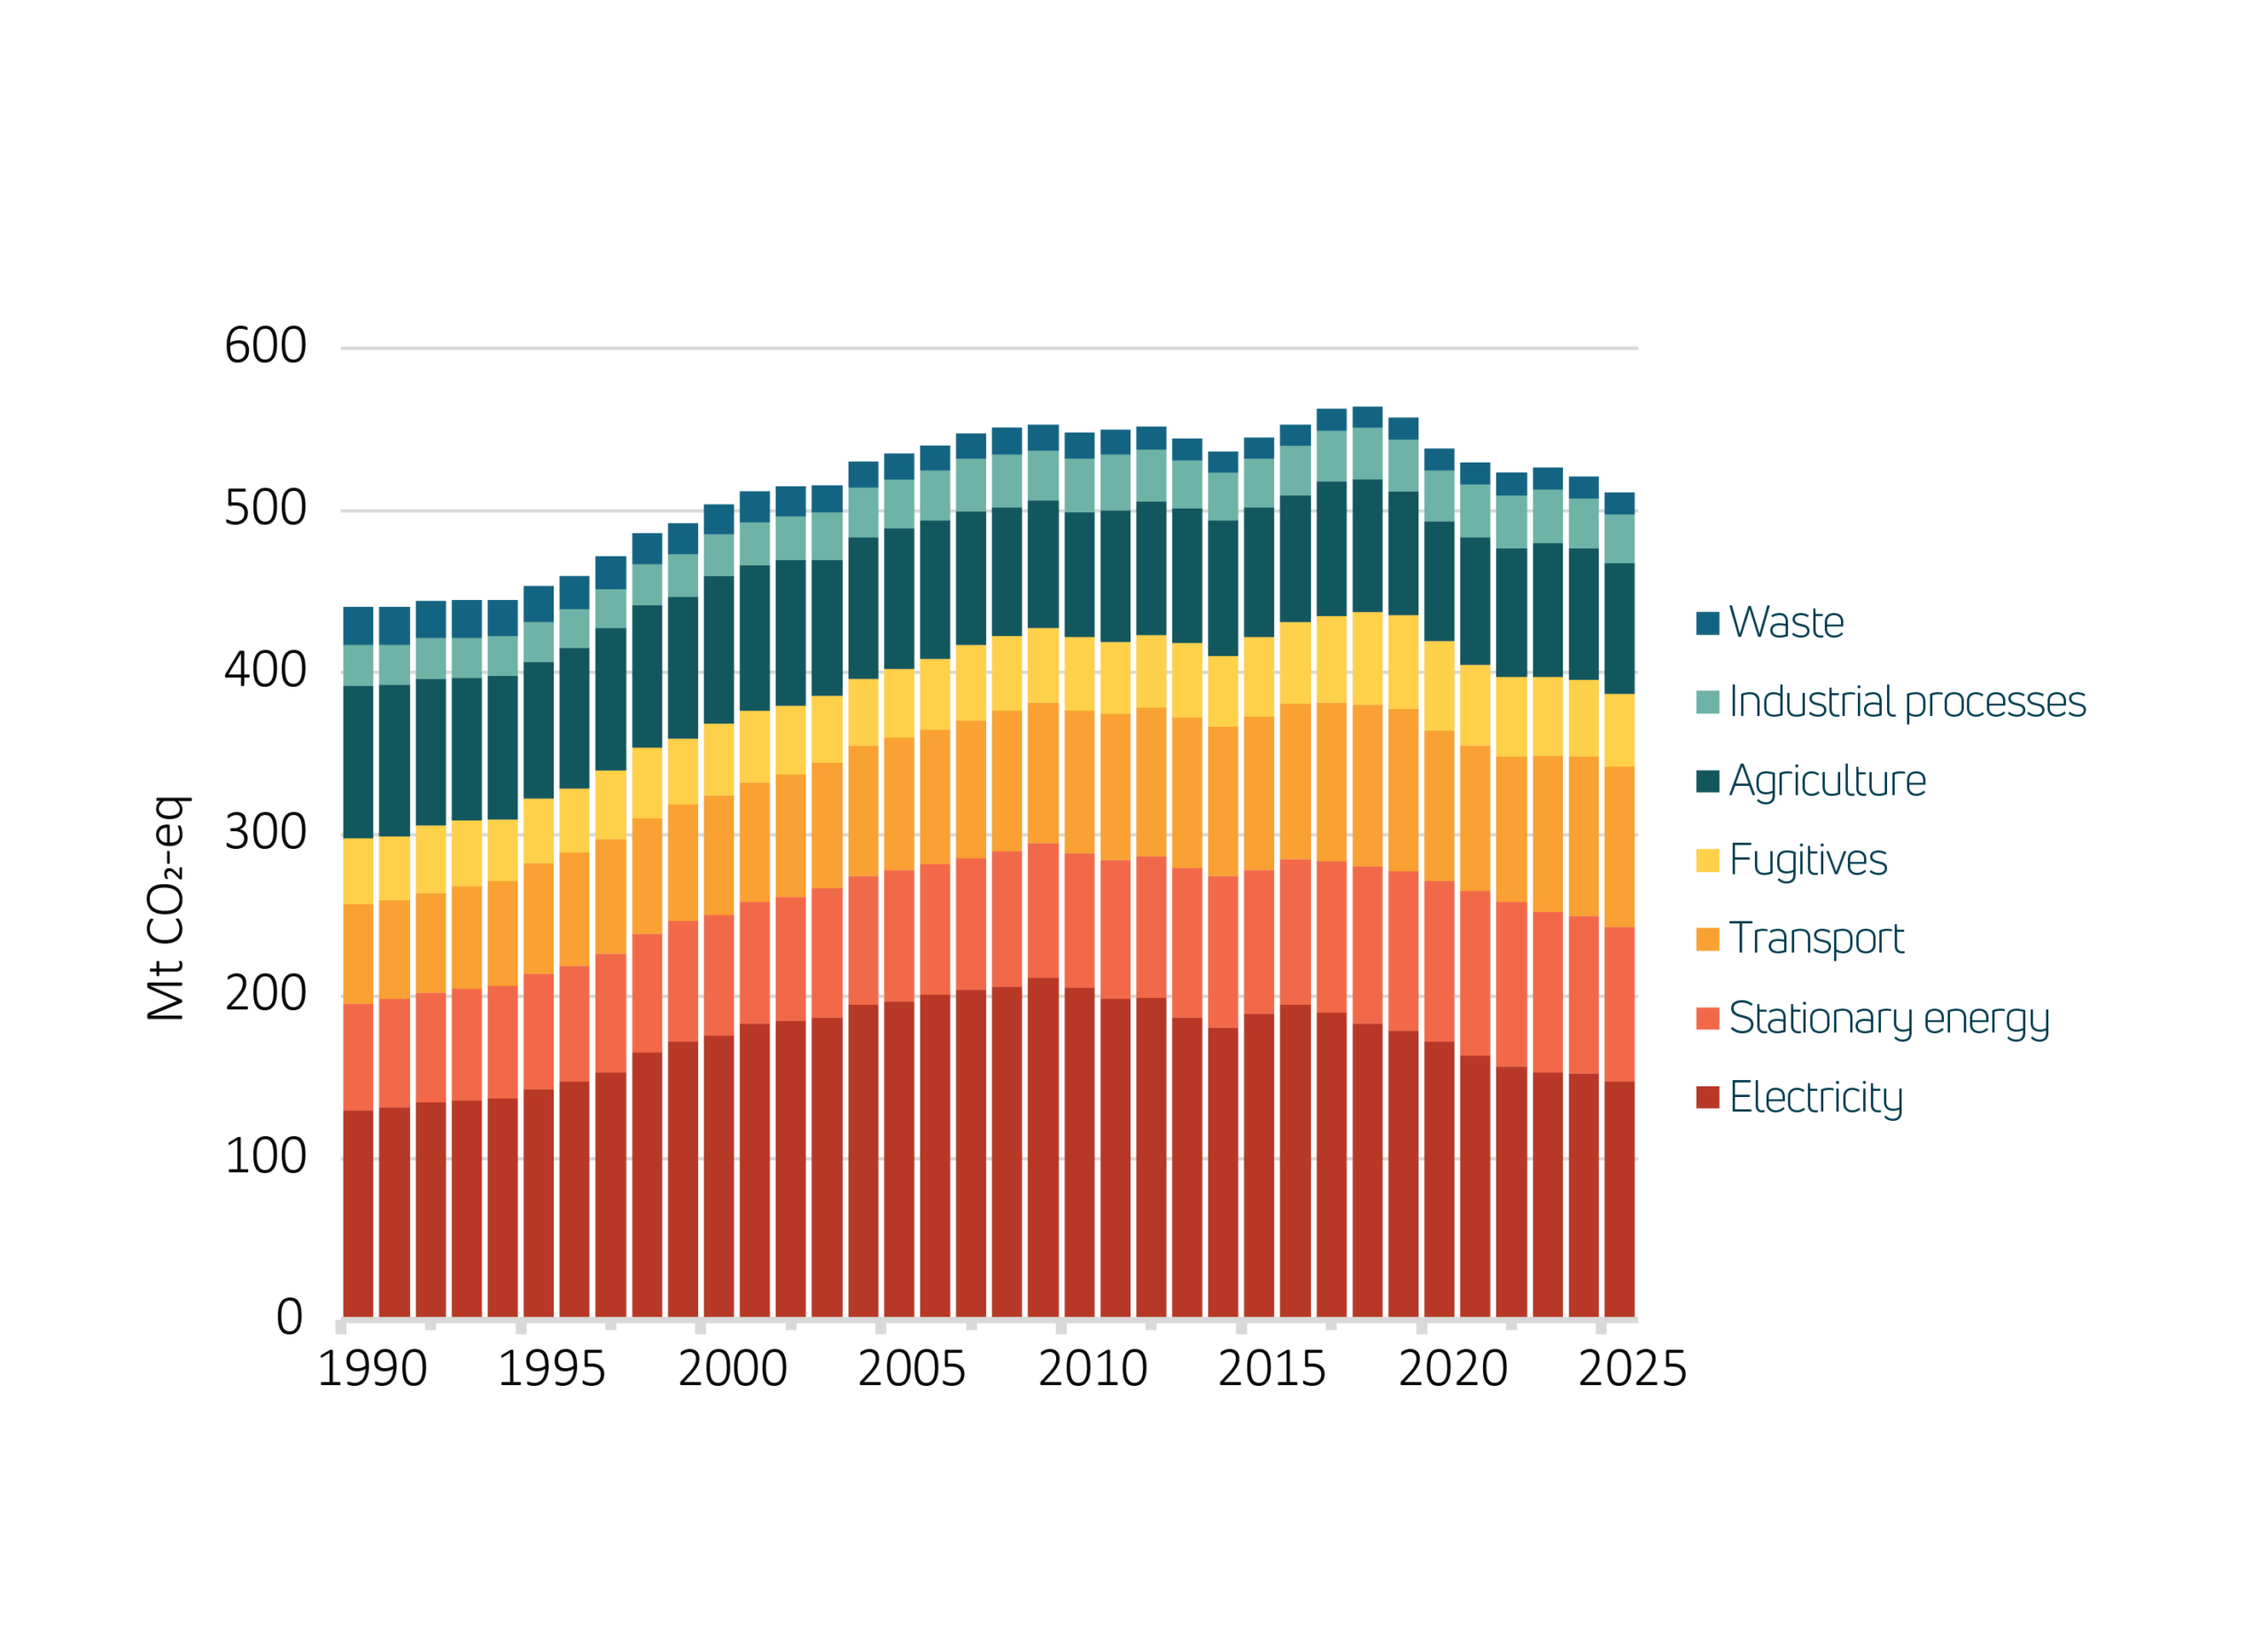
Total emissions were 511 Mt CO2-eq, 5% below the 2000–2025 average. Emissions decreased across most sectors, with the largest reductions in fugitives (-4.3%), electricity (-3.3%), stationary energy (-2.0%) and industrial processes (-2.2%), and a smaller reduction in agriculture (-0.6%). Transport emissions grew slightly (+0.3%) and waste emissions were unchanged.
Emissions per person fell by 3.4% to 18.5 tonnes CO2-eq — 30% below the peak of per- capita emissions around 2000–2005. Australia is the world’s 15th largest emitter, contributing about 1% of global emissions. Per capita, however, Australians are among the world’s greatest greenhouse gas emitters, releasing about three times the global average. This reflects the energy intensity of the economy and the high carbon footprint of Australian lifestyle including transport, housing and consumption.
Where does this data come from?
Measures of the condition of natural resources and ecosystems were derived from several spatial data sources.
Weather data was derived by combining station satellite and weather forecast model data.
Data on land cover, inundation, fire, soil condition and vegetation leaf area were derived by automated interpretation of satellite imagery. Biodiversity analysis was based on the DCCEEW SPRAT database and Threatened Species Index (TSX), providing measures of change in the relative abundance of Australia's threatened and near-threatened species at national and regional levels.
The other indicators were estimated by combining the weather and satellite data in ANU's environmental data assimilation system, OzWALD.
For further details on data and methods or to download the data, read more.