
 Vegetation
Key points
- Vegetation condition improved from the previous year and was among the best on record, driven by above-average rainfall across the north and east.
Vegetation condition
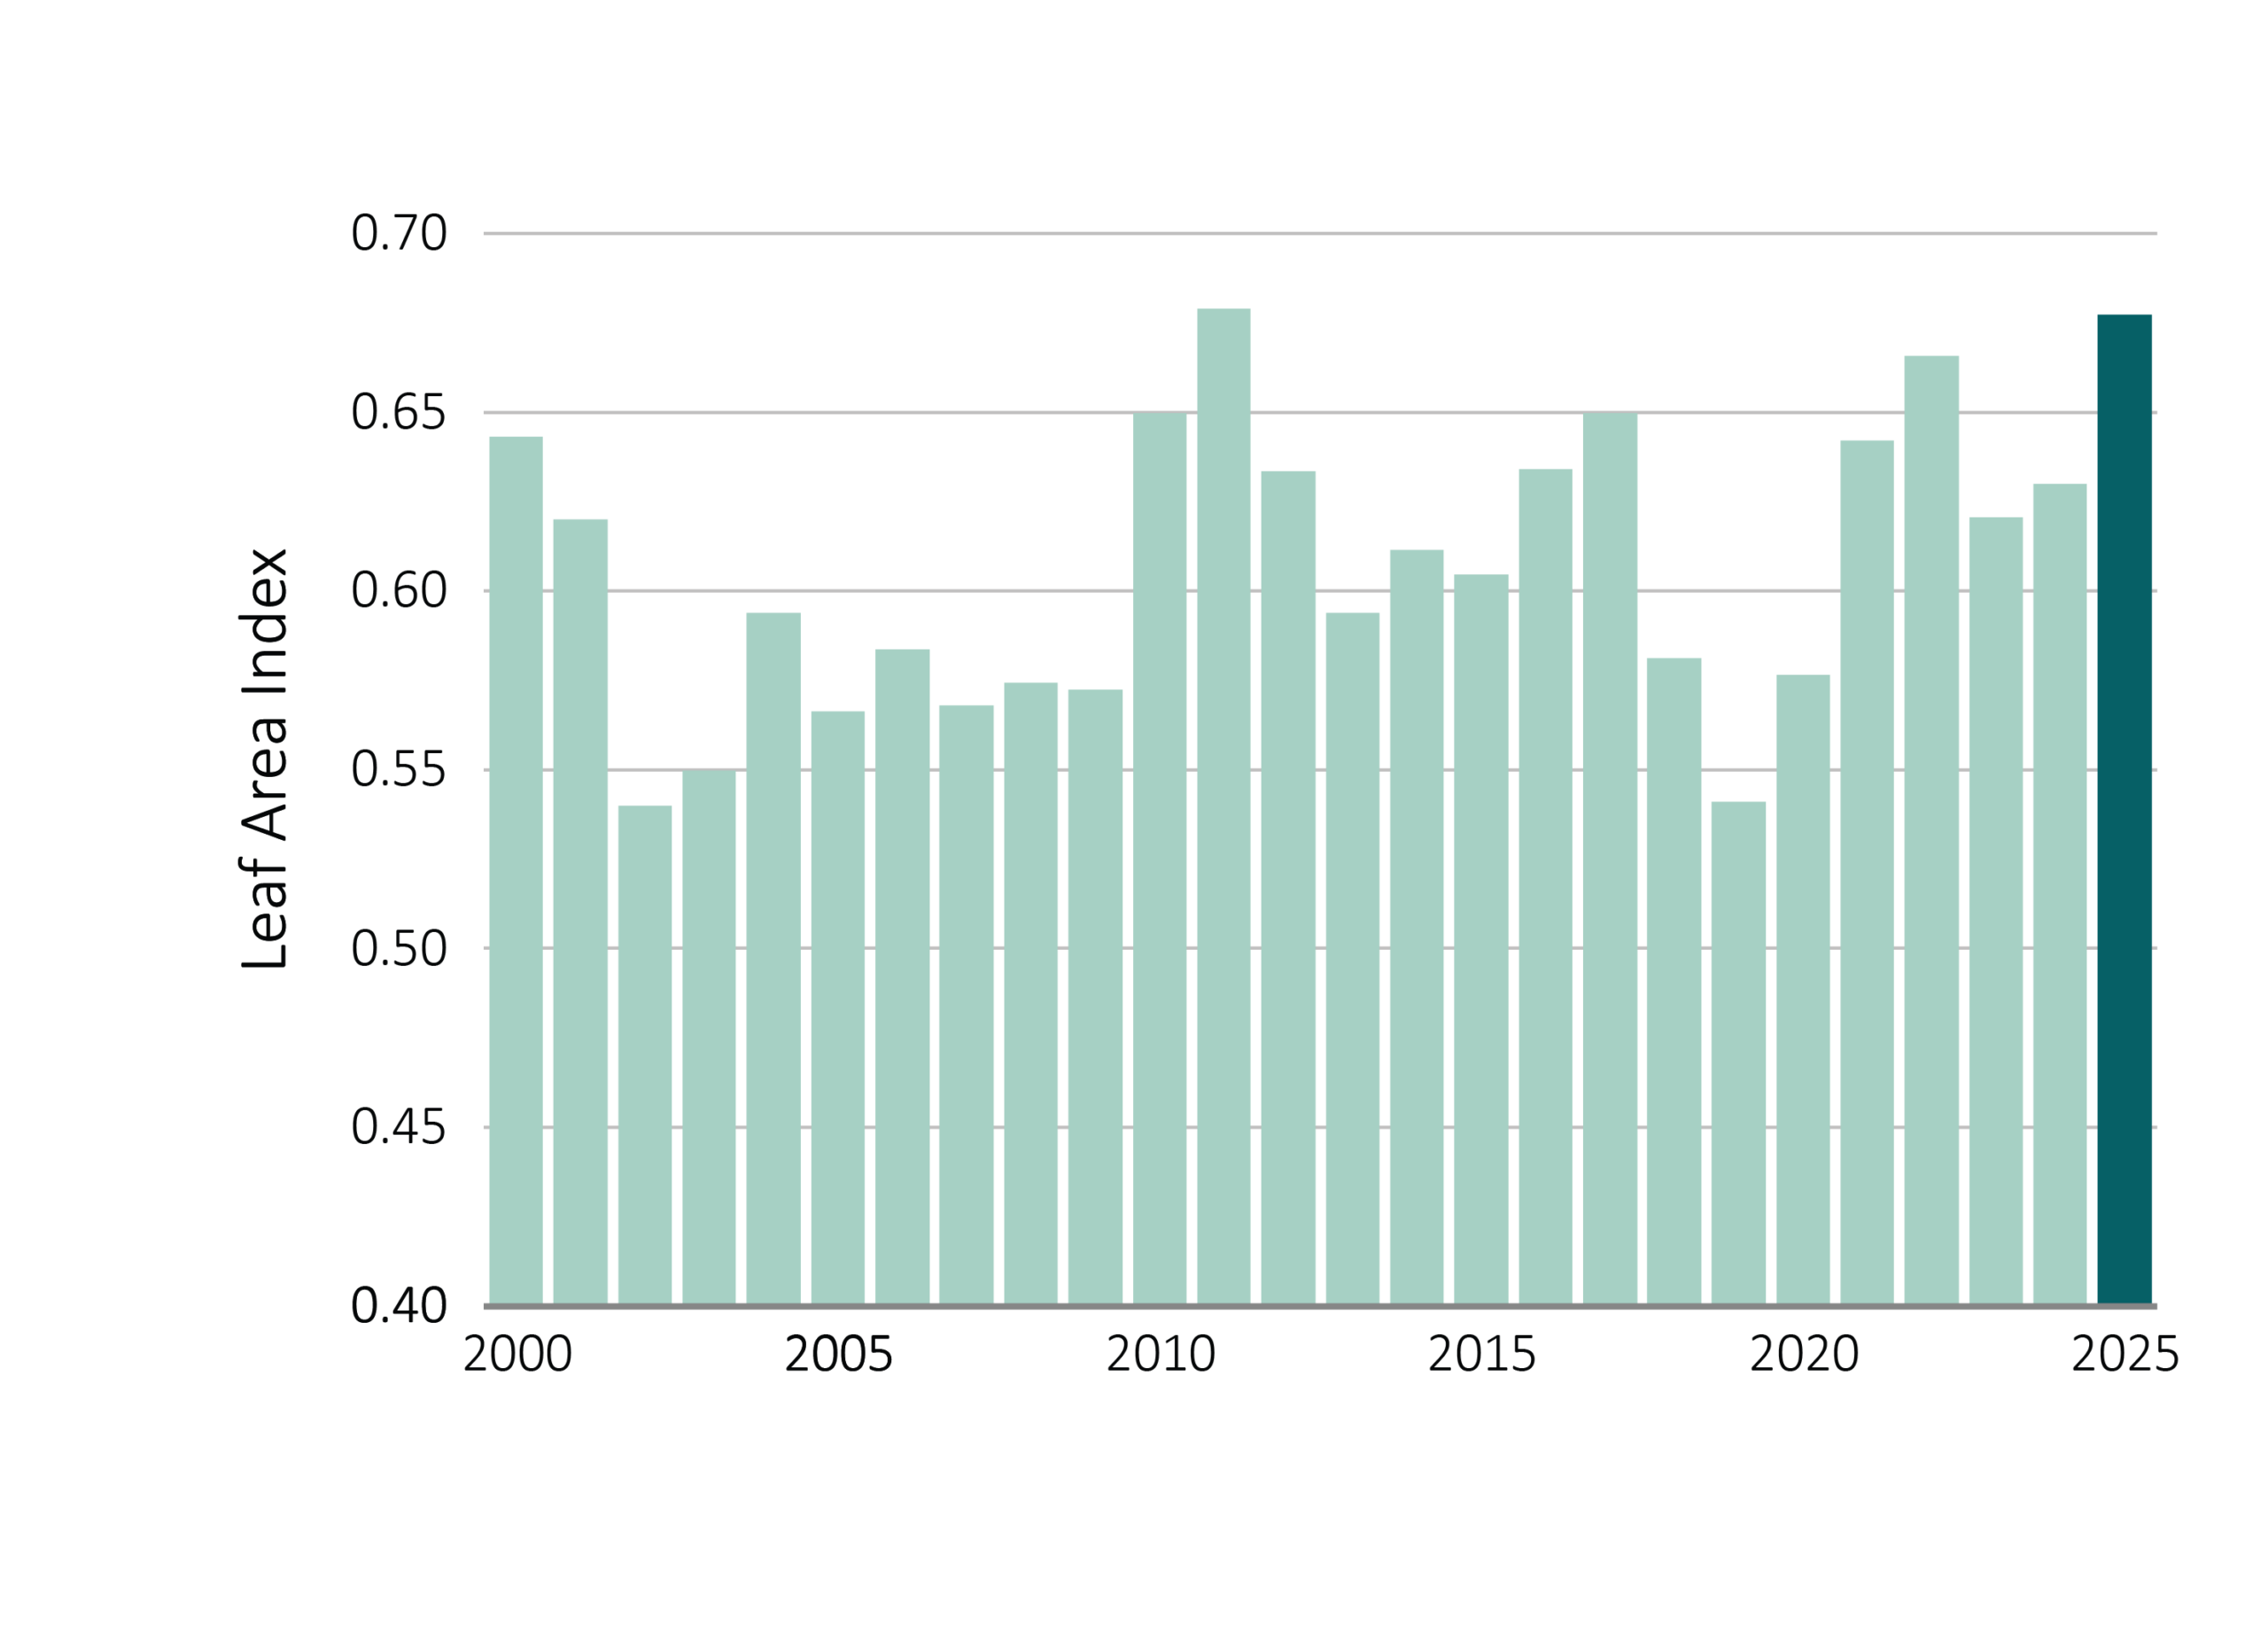
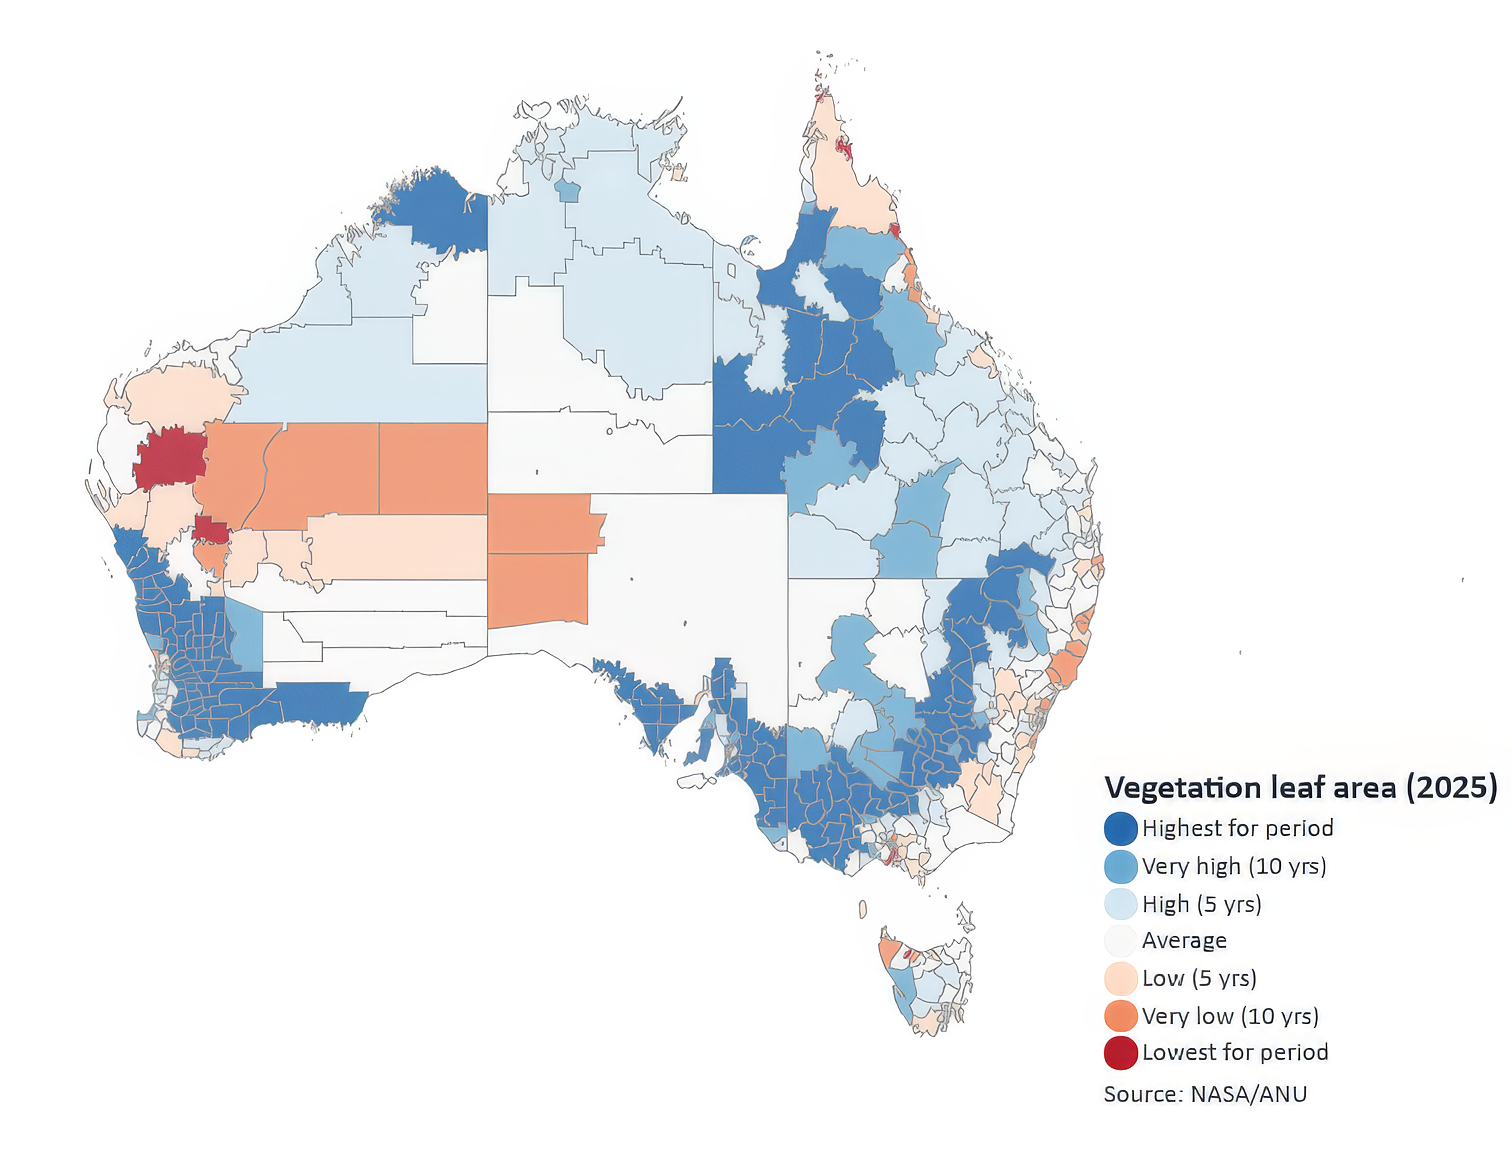
National vegetation condition, measured by the leaf area index — the density of green leaf cover across the landscape — rose 8% from 2024 to reach 0.68, joint highest since national records began in 2000, alongside 2011. It was 12% above the 2000–2024 average. Above- average vegetation conditions were observed across much of Queensland, the Northern Territory and coastal NSW, consistent with above-average rainfall in those regions. Below- average vegetation conditions occurred in southern and south-western WA and parts of SA and Victoria, where soil moisture was also at its lowest on record.
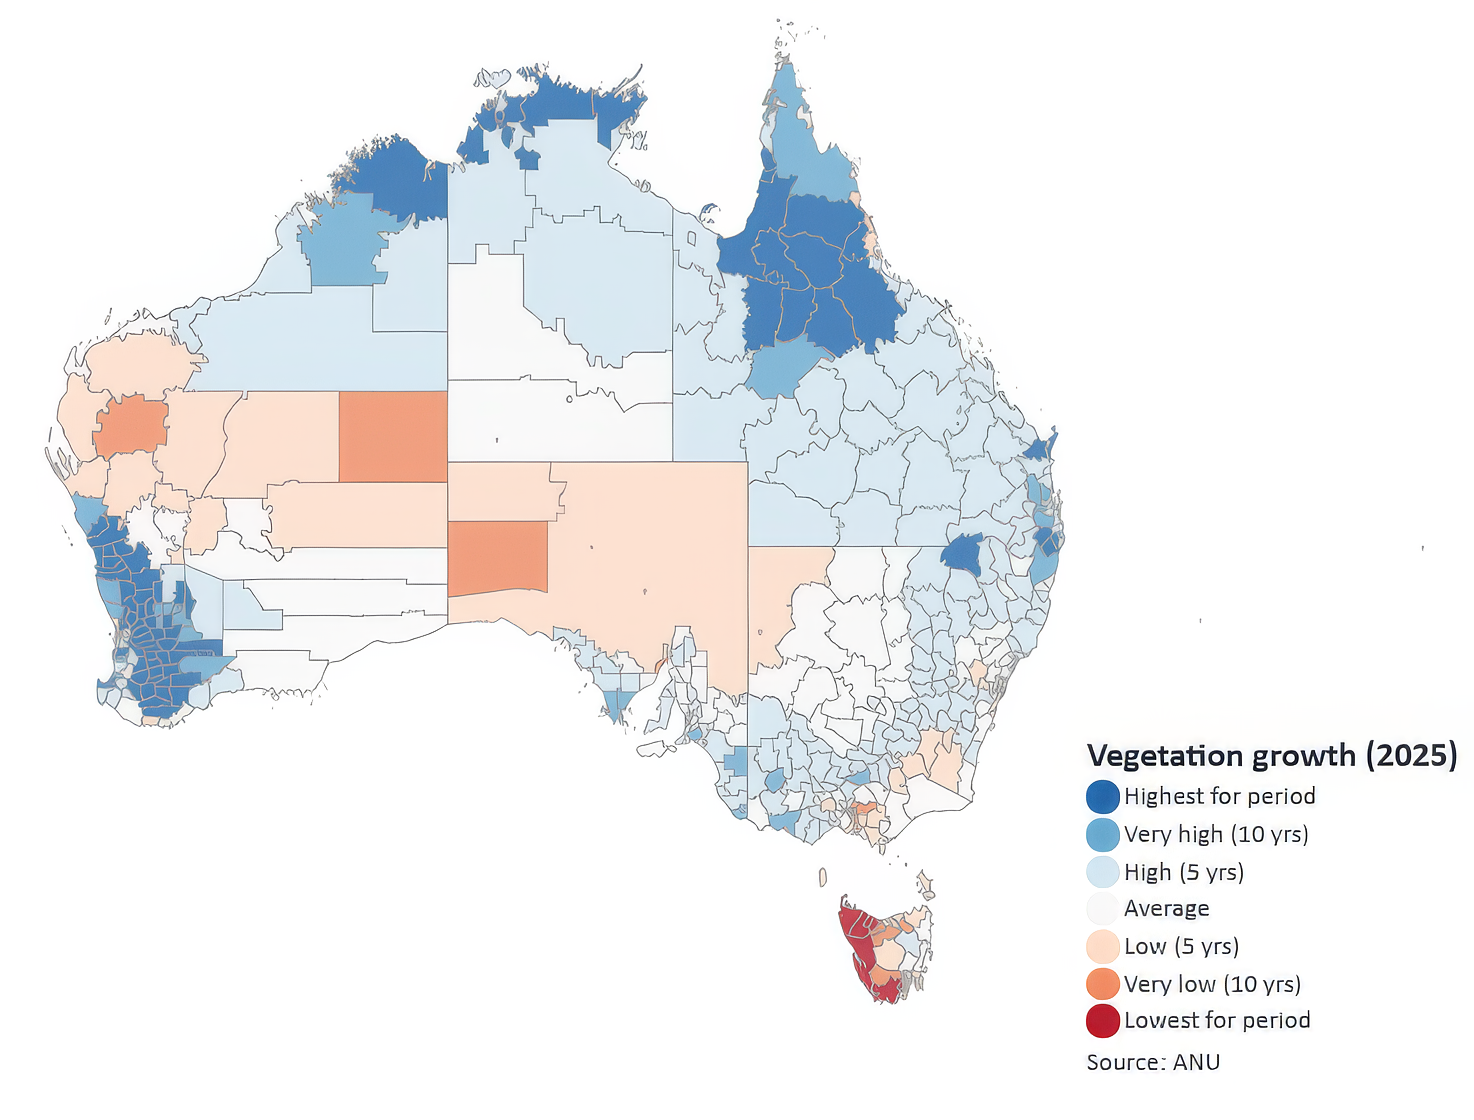
Vegetation growth rates, estimated from a combination of weather and satellite data, were the third highest on record. National carbon uptake — the rate at which vegetation absorbs CO₂ through photosynthesis — was 630 gC/m², only 1% higher than 2024 but 14% above the 2000–2024 average. This can be attributed to good monsoon rainfall across northern Australia and above-average growing conditions across much of the east. The model estimates also include a small long-term increasing trend associated with rising CO₂ concentrations. Growing conditions were near or above average across most of Australia, with the main exception being parts of southern and south-western WA where dry conditions limited vegetation growth.
Vegetation primary production was above average in all land use sectors. Nationally, growth conditions were above average for dryland cropping (32% above 2000–2024 average conditions), grazing (+17%) and irrigation (+16%). Growth was closer to average for natural vegetation (+7%), planted and native production forests (+2%) and intensive agricultural, industrial and urban land uses (-9%).
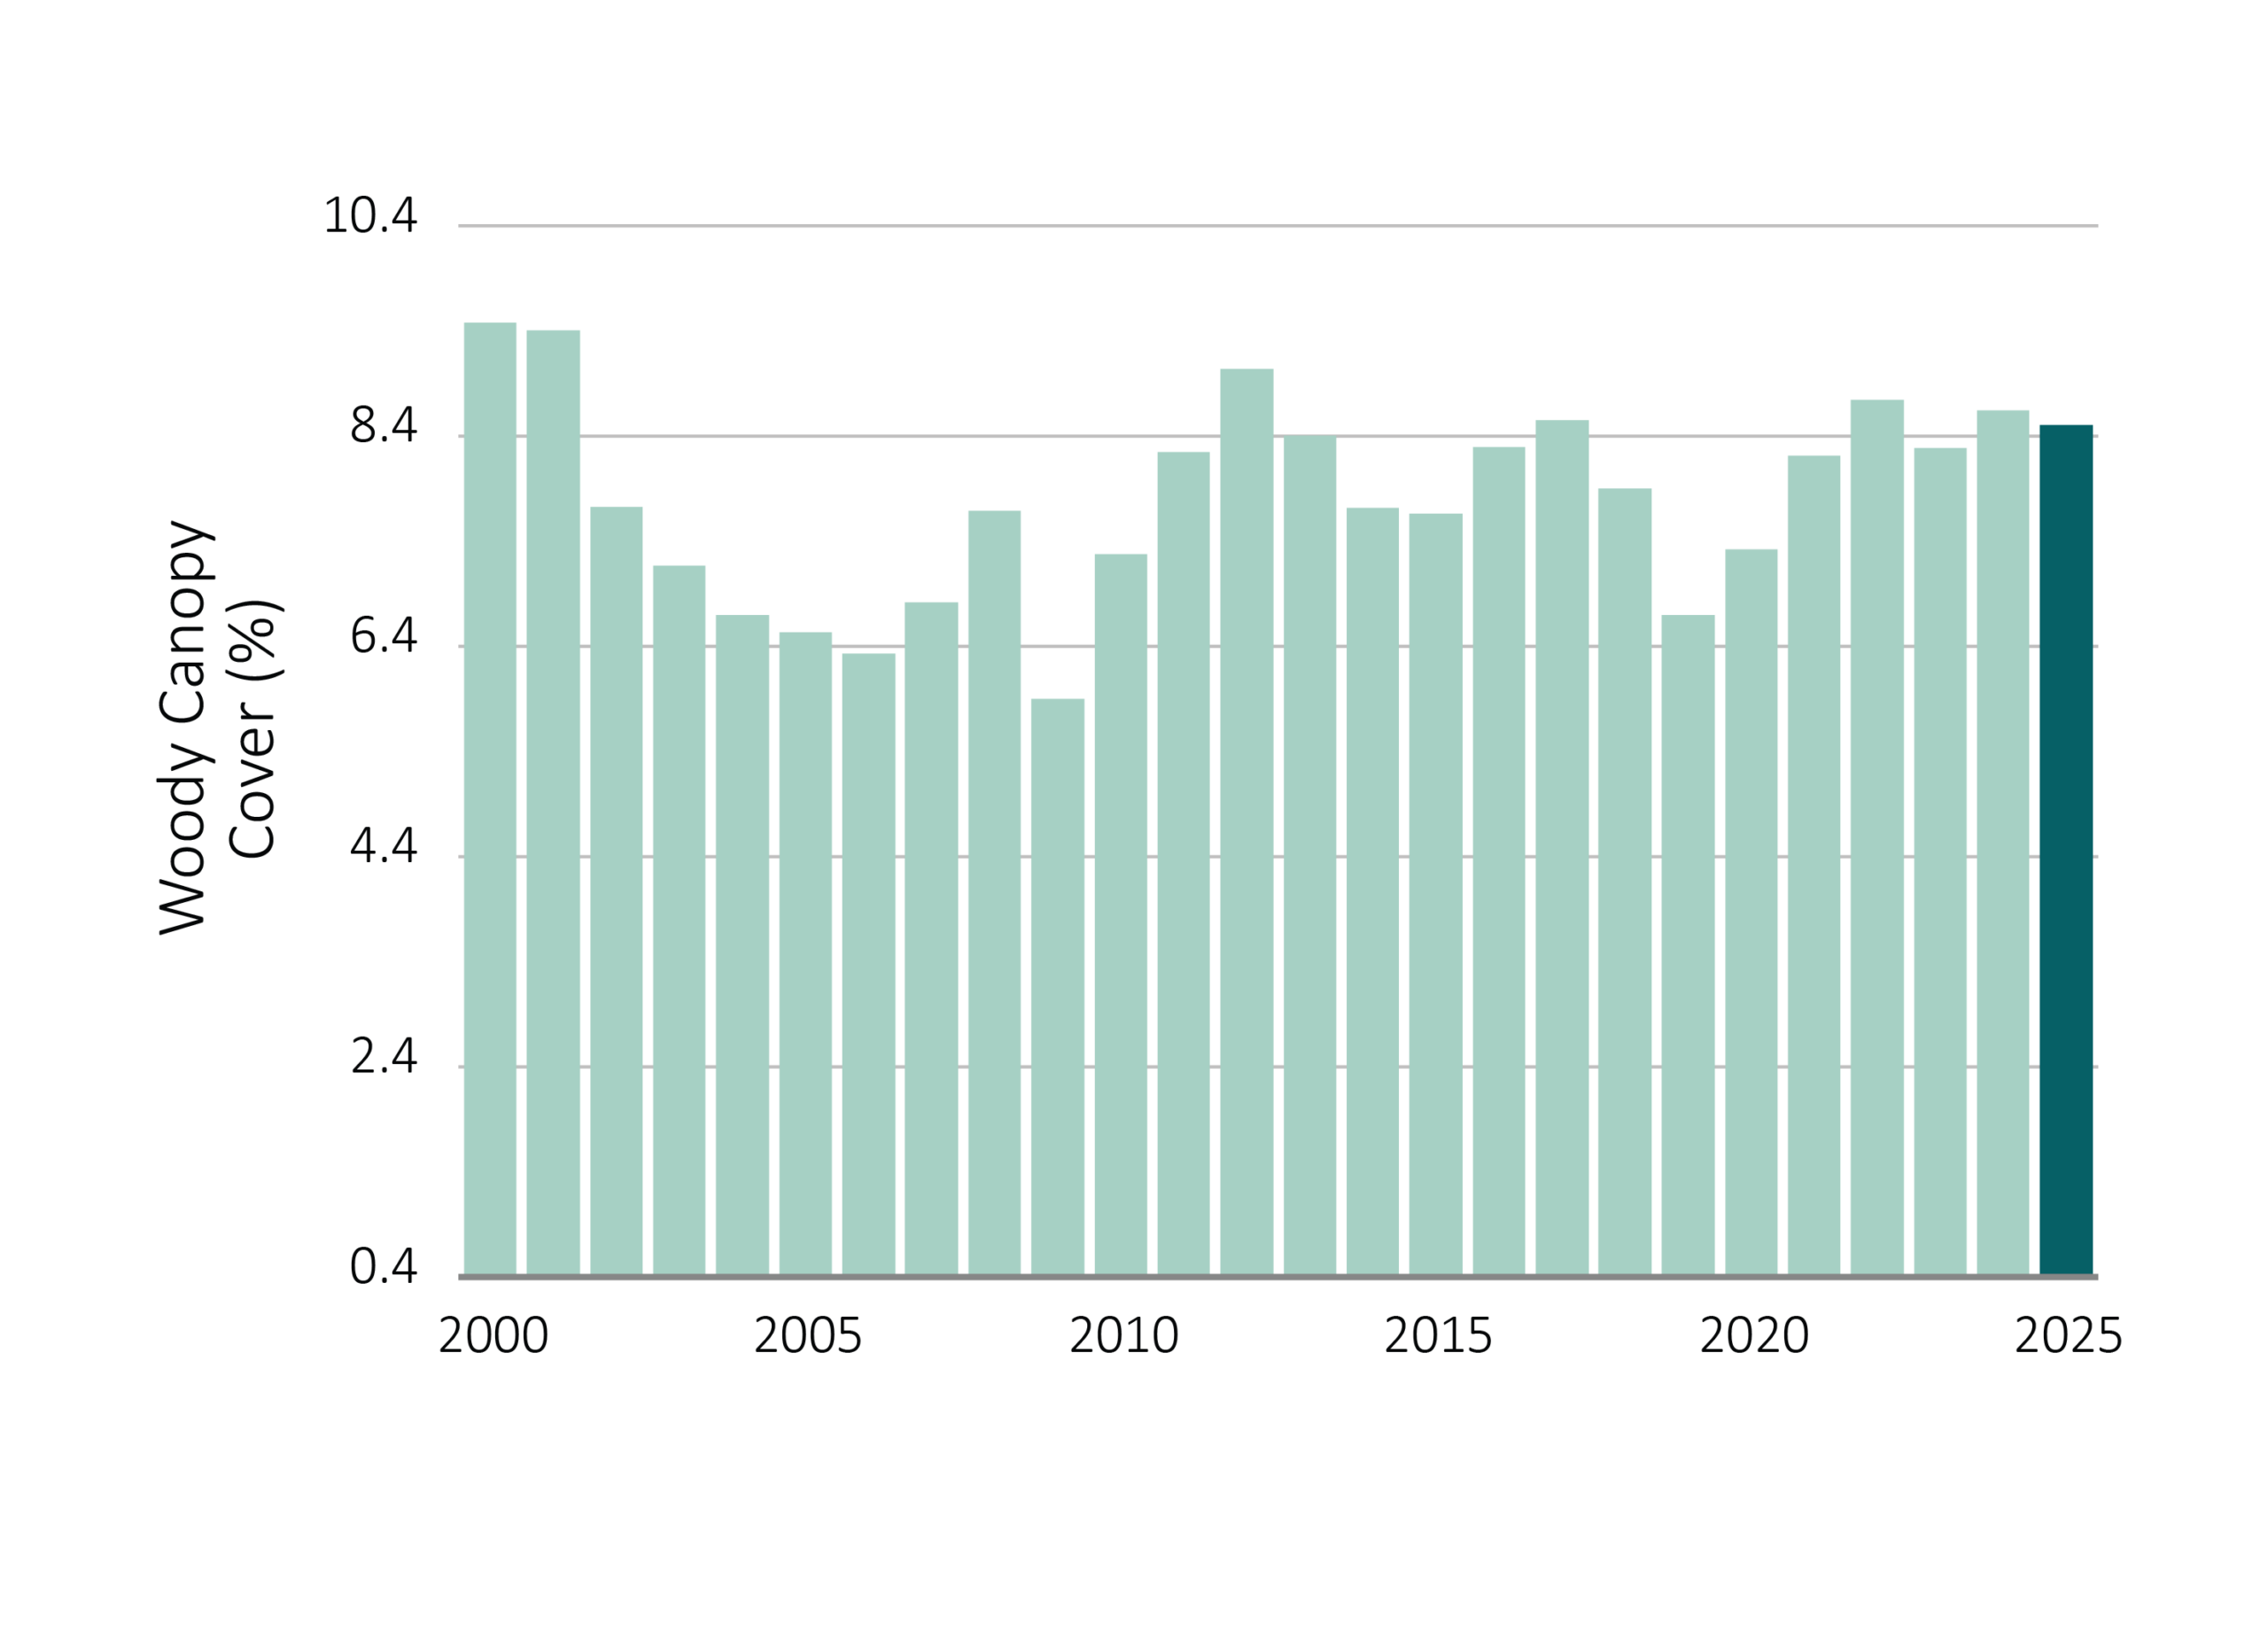
Woody canopy cover — the fraction of land covered by trees and shrubs taller than 2 metres — was 8.4%, slightly below 2024's 8.5%, but 9% above the 2000–2024 average and the sixth-highest value on record. Canopy cover declined slightly across parts of southern and south-eastern Australia, consistent with declining soil moisture in those regions, while remaining stable or increasing across northern Australia and Queensland. These changes can mostly be attributed to changes in water availability rather than land clearing or fire.
Australia's terrestrial vegetation was a large carbon sink in 2025. Net ecosystem exchange — the net uptake of carbon by vegetation after accounting for ecosystem respiration — was 201 gC/m², equivalent to approximately 2972 Mt CO₂, the second-highest value since 2000 and nearly identical to the 2022 record. It was 7% higher than 2024 and 28% above the 2000–2024 average. After subtracting fire emissions of approximately 429 Mt CO₂, the net land carbon sink was around 2543 Mt CO₂ — roughly five times Australia's greenhouse gas emissions in 2025.
This underscores the critical role of Australia's landscape in the global carbon cycle, and the sensitivity of that role to year-to-year variation in rainfall, vegetation growth and fire activity.
Where does this data come from?
Measures of the condition of natural resources and ecosystems were derived from several spatial data sources.
Weather data was derived by combining station satellite and weather forecast model data.
Data on land cover, inundation, fire, soil condition and vegetation leaf area were derived by automated interpretation of satellite imagery. Biodiversity analysis was based on the DCCEEW SPRAT database and Threatened Species Index (TSX), providing measures of change in the relative abundance of Australia's threatened and near-threatened species at national and regional levels.
The other indicators were estimated by combining the weather and satellite data in ANU's environmental data assimilation system, OzWALD.
For further details on data and methods or to download the data, read more.