
 Water
Water
Key points
- River flows declined from the previous year but remained above the long-term average. Flooding in inland Australia filled Kati Thanda–Lake Eyre while conditions were dry in the Murray Basin.
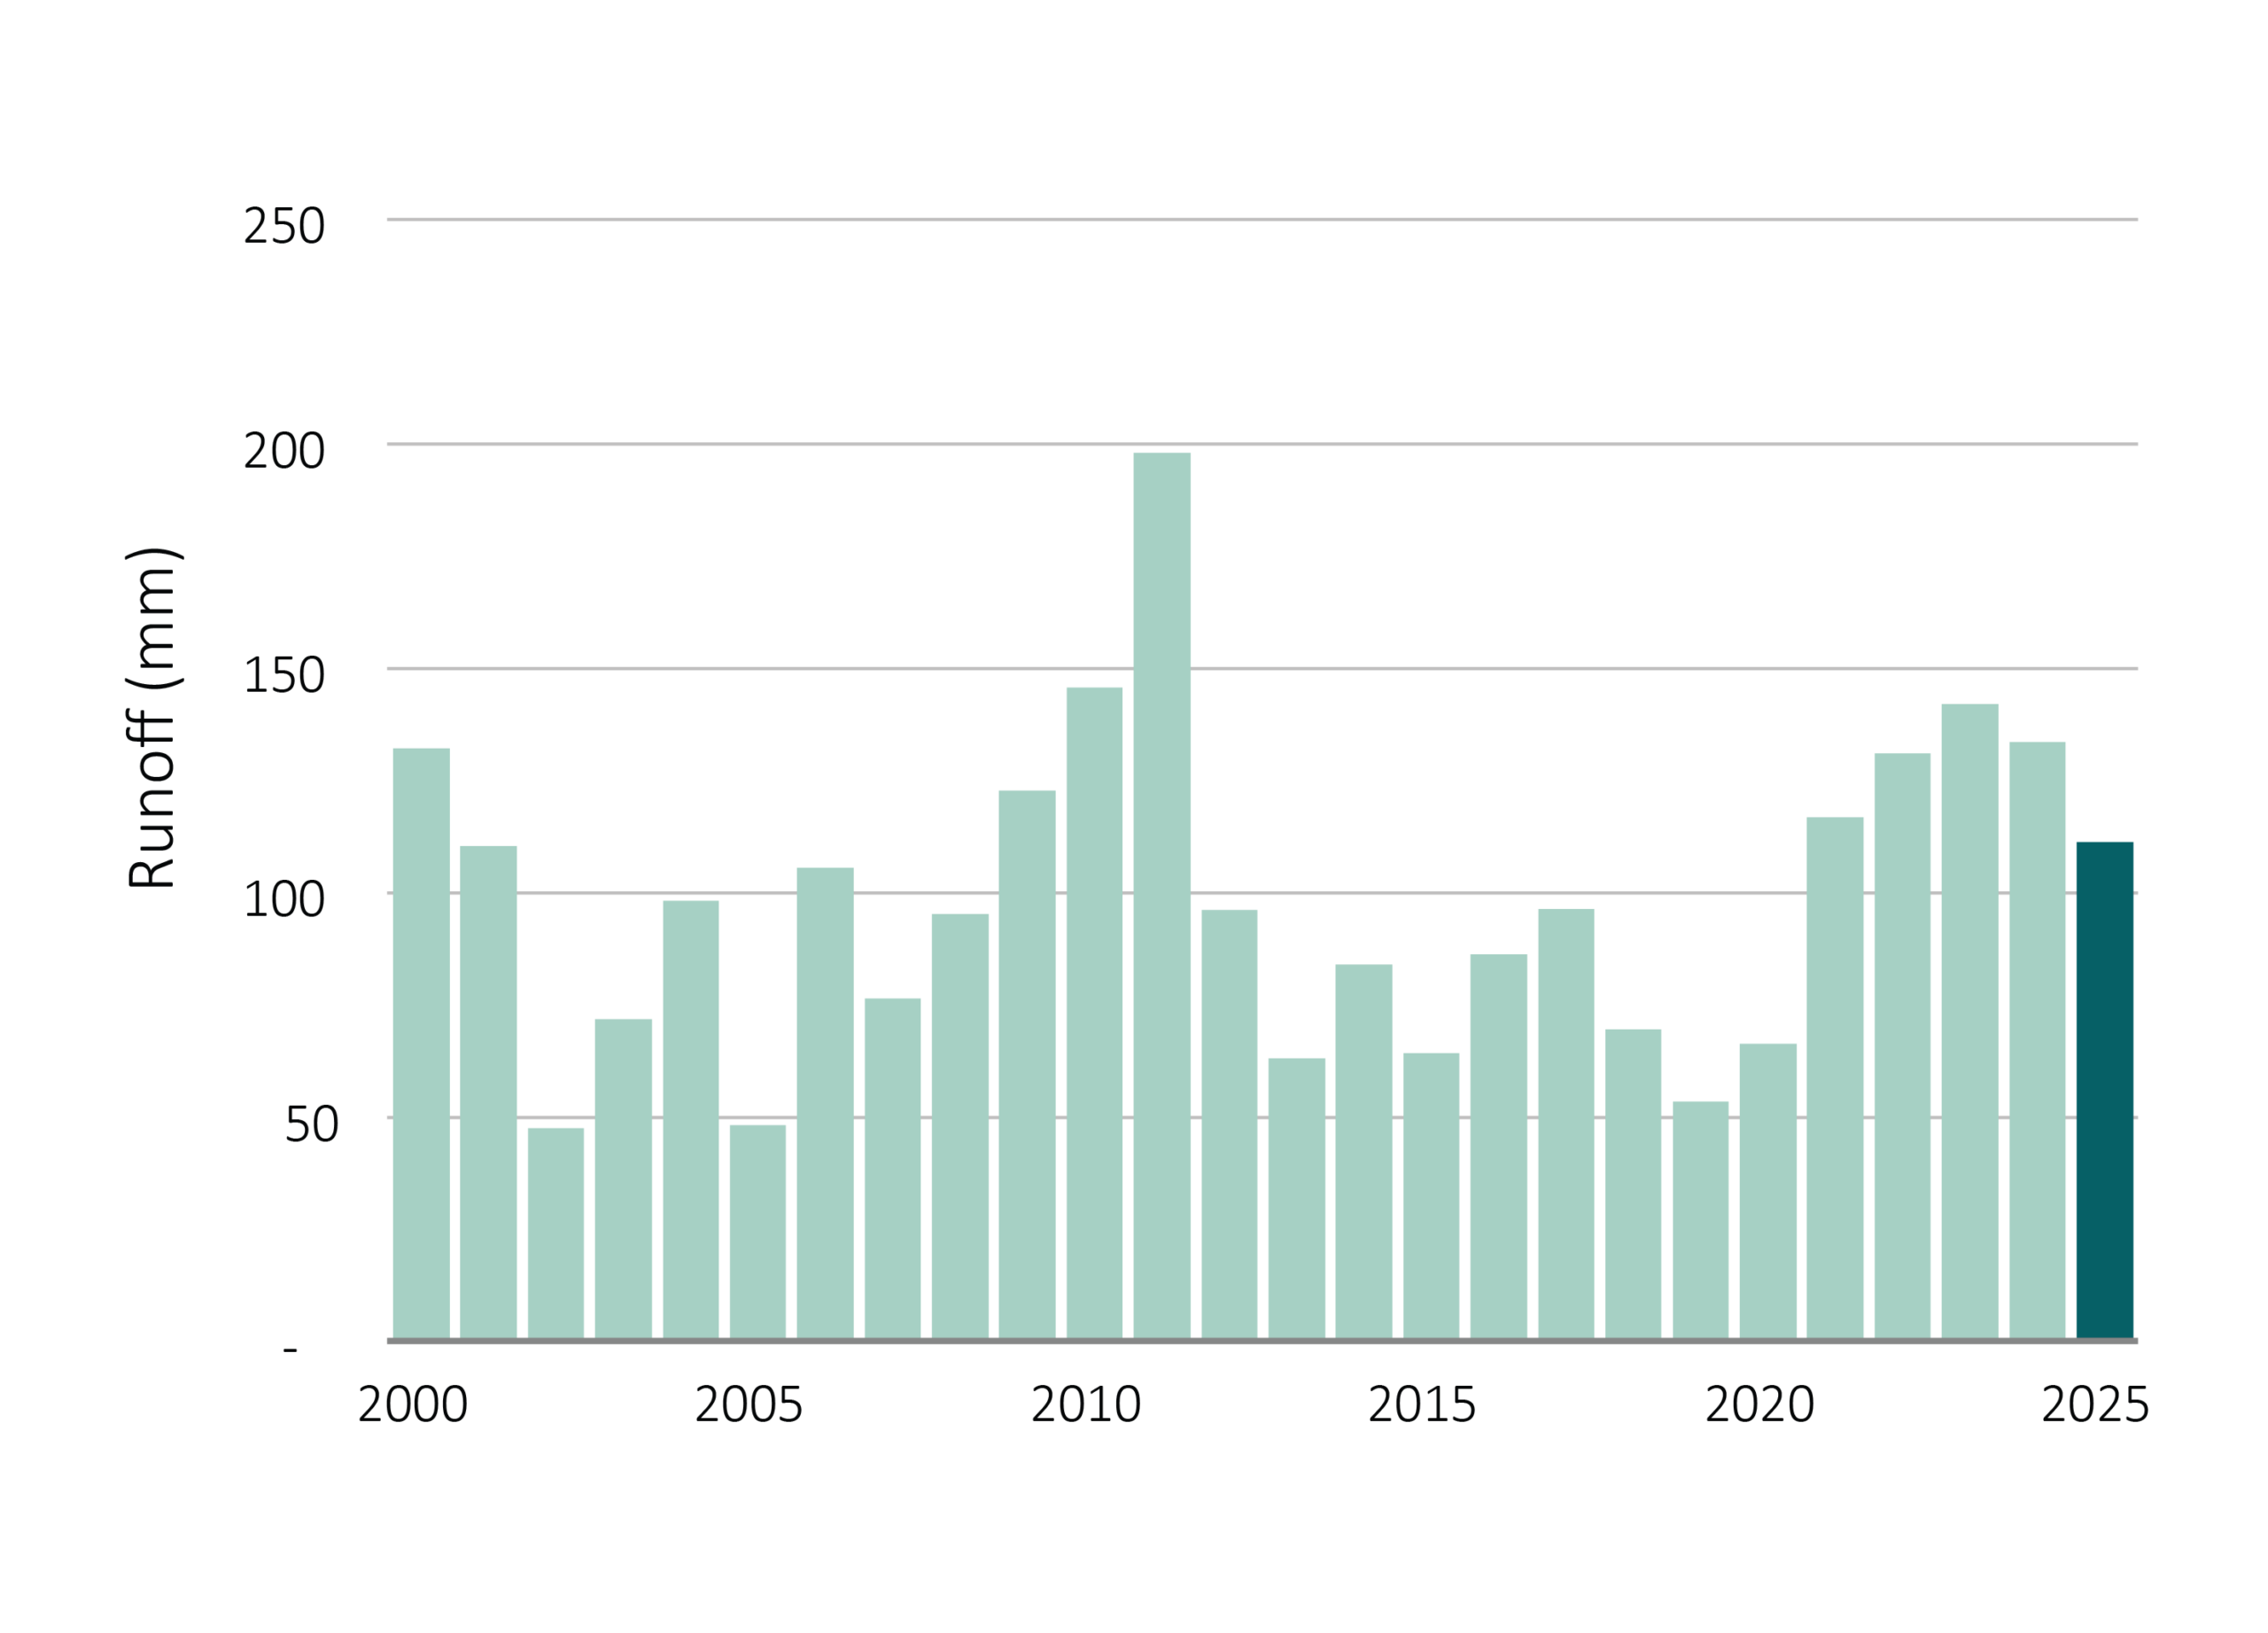
National river runoff was 111 mm or approximately 850,000 GL — 17% less than 2024 but 13% above the 2000–2024 average. Nationally, runoff was the fifth-highest since 2000, following four consecutive above- average years.
Streamflow was above average across much of north-eastern New South Wales and parts of northern Queensland, consistent with above- average rainfall in those regions. Conversely, streamflow was below average across most of south-eastern Australia including Victoria and Tasmania, and parts of Western Australia, reflecting the third consecutive year of below- average winter rainfall.
The year 2025 saw several significant flood events. In late January to early February, persistent heavy monsoon rainfall across coastal north Queensland caused major flooding along multiple rivers between Townsville and Cairns, with some catchments exceeding their previous monthly rainfall records. In March, Tropical Cyclone Alfred brought major flooding to south-east Queensland and north-east New South Wales, with Brisbane recording its highest daily rainfall since 1974. Later in the year, flooding occurred in parts of New South Wales in May and again in November and December as multiple weather systems brought above-average rainfall.
Surface water storage across Australia declined from 73% to 68% of accessible capacity during 2025, continuing a slight decline from 74% at the start of 2024. Storage in the southern Murray–Darling Basin fell from 73% to 59%. Sydney’s Warragamba Dam remained very high at 95%. Brisbane’s Wivenhoe Dam declined from 90% to 81%, after having risen strongly in 2024. Melbourne water supplies fell from 86% to 75%. Adelaide recovered slightly from 45% to 64%, assisted by desalination, after having fallen sharply during 2024. Perth ended the year at 44% of capacity, remaining low and continuing its long- term decline driven by declining winter rainfall. The city relies on desalination and groundwater to meet demand.
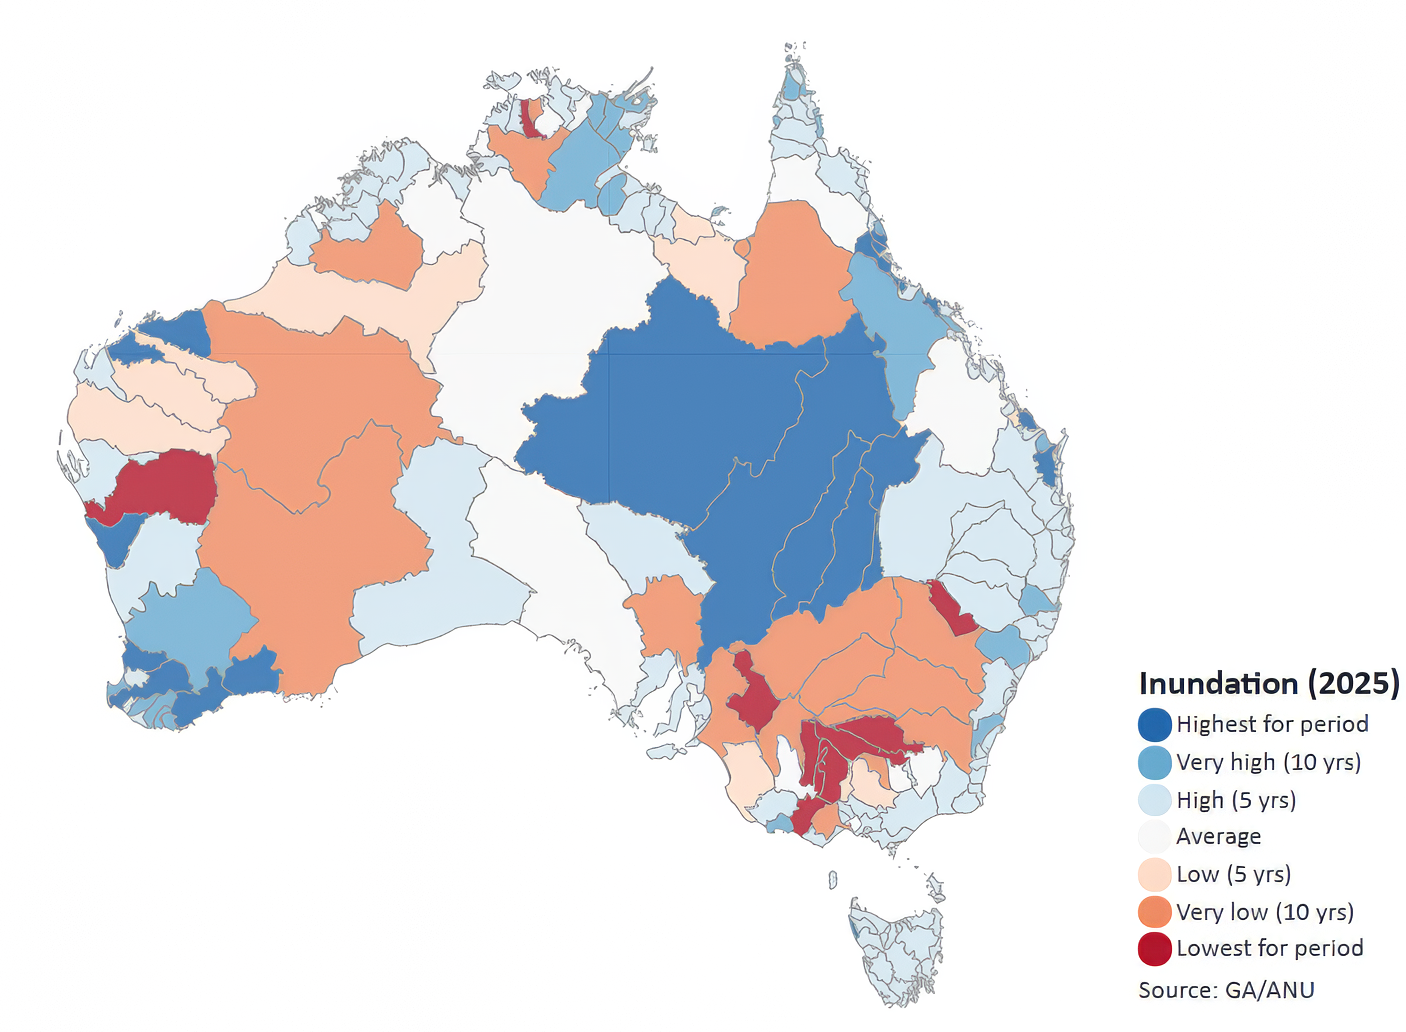
The area inundated during all or part of 2025 was the highest since 2011 and 85% above the 2000–2024 average, but there were strong regional contrasts. Inundation was the highest since at least 2000 across much of central and western Queensland, where exceptional rainfall sent floodwaters through the Channel Country river systems toward Kati Thanda–Lake Eyre. Flood levels along Cooper Creek exceeded the famous 1974 flood at several locations, producing the most significant filling of Kati Thanda–Lake Eyre in at least 15 years. The lake fills completely only a handful of times per century and the 2025 event triggered mass hatching of dormant invertebrates, fish breeding and the arrival of waterbirds from across the continent.
By contrast, inundation was very low across much of inland Western Australia, South Australia and the southern Murray-Darling catchments. The UNSW annual aerial survey of up to 2000 wetlands across a third of the continent counted 31% more water birds than 2024 but 35% fewer than 2023 and below the long-term average. Breeding remained very low for the third consecutive year, concentrated almost entirely at a handful of Queensland Channel Country sites.
Where does this data come from?
Measures of the condition of natural resources and ecosystems were derived from several spatial data sources.
Weather data was derived by combining station satellite and weather forecast model data.
Data on land cover, inundation, fire, soil condition and vegetation leaf area were derived by automated interpretation of satellite imagery. Biodiversity analysis was based on the DCCEEW SPRAT database and Threatened Species Index (TSX), providing measures of change in the relative abundance of Australia's threatened and near-threatened species at national and regional levels.
The other indicators were estimated by combining the weather and satellite data in ANU's environmental data assimilation system, OzWALD.
For further details on data and methods or to download the data, read more.